America’s ground-transportation system is the essence of complex. According to a 2013 report from the U.S. Department of Transportation (DOT), it includes approximately 4 million miles of state and local roads, 136,000 miles of federal highways, 604,000 bridges, and 141,000 miles of rail, 80% of which are for freight. In addition to the 250-million-plus private cars and trucks in the United States, more than 74,000 commercial buses operate on our highways, while 31,602 train cars and locomotives keep intercity, commuter and subway systems rolling.
The purpose of the DOT report, “2013 Status of the Nation’s Highways, Bridges, and Transit: Conditions and Performance,” is to provide Congress with key statistics and data-driven context on the current state of the nation’s transportation system and its anticipated future needs. The report’s title undersells its content somewhat, as it’s about far more than just the state of U.S. infrastructure. Included are long-term trends in funding sources and expenditures, transportation safety, freight patterns and Americans’ travel-mode choices. Also notable is some discussion of the need to foster “livable communities,” an outgrowth of the DOT’s 2012-2016 strategic plan, as well as the introduction of performance-management requirements from the 2012 Moving Ahead for Progress into the 21st Century Act (MAP-21).
As with all major U.S. government reports, this one is substantial, weighing in at 482 pages. But its authors made considerable effort to present key metrics and trends in graphic and tabular form. Below are 12 graphs from the report with explanatory information and additional resources where appropriate.
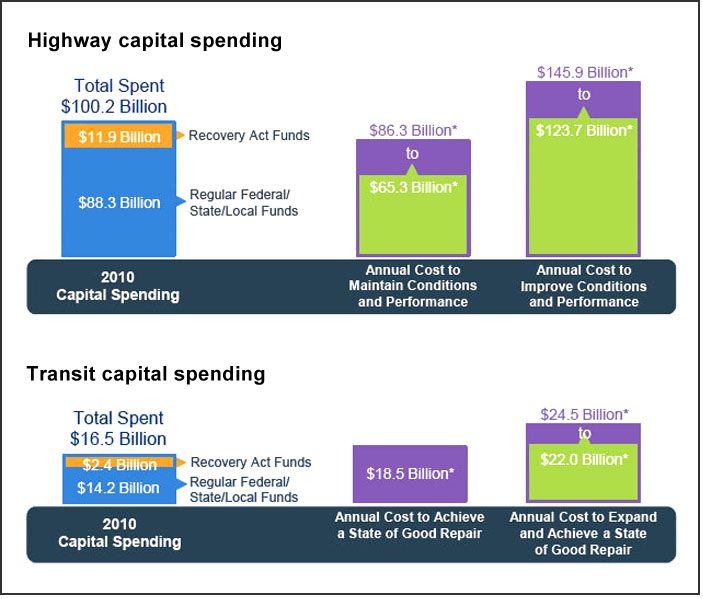
1. Highway and transit capital-spending needs
While the United States has its share of new highway projects, state-of-the-art airports and starchitect-designed transit hubs, the American Society of Civil Engineers (ASCE) gave the country’s infrastructure a D+ grade in its annual report card. The 2014 Department of Transportation report finds that to maintain the condition of U.S. highways and bridges at 2010 levels through the year 2030, between $65.3 billion and $86.3 billion per year would be required. If all “cost-beneficial investments” were made, between $123.7 billion and $145.9 billion per year would be required. (The independent variable in the equation is the number of vehicle miles traveled, or VMT; more on that below.) For transit, the DOT calculates that $18.5 billion per year is required to maintain a good state of repair through 2030, and $22 billion to $24.5 billion to expand the current system.
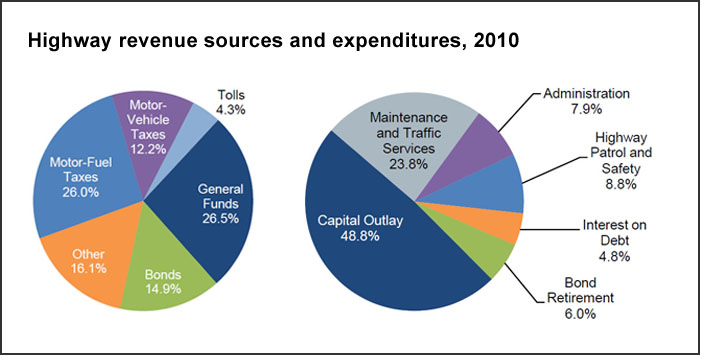
2. Highway revenue sources and expenditures
Both highway revenues and outlays figure prominently in the report. In the year 2000, highway-user charges made up 62% of highway revenues, but in 2010 provided only 42.5% — a direct consequence of the ongoing effects of inflation on the gas tax, state and federal reluctance to increase the tax rates, and improving vehicle fuel efficiency. The shortfall has been made up by increasing appropriations from general funds and bonds, among other sources. Of the more than $200 billion spent on U.S. highways in 2010, about half was used for capital investments and a quarter for routine maintenance and traffic services. Given the failing grades that existing U.S. roads received from the ASCE, the implication is that road expansion continues even as maintenance is shortchanged.
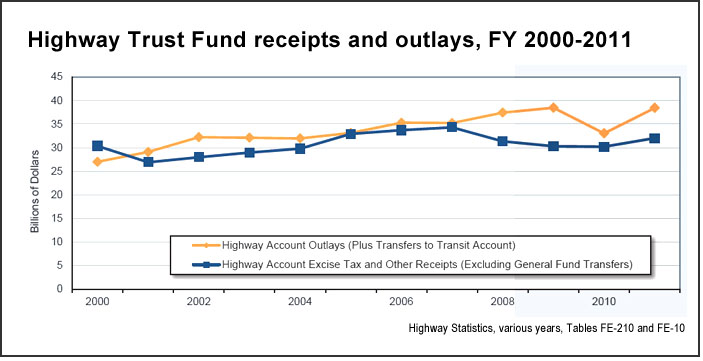
3. Highway Trust Fund receipts and outlays, FY 2000-2001
The U.S. Highway Trust Fund was established in 1956 to ensure that funds from user taxes were dedicated to the interstate system’s construction and maintenance. Because of the falling value of the gas tax, Trust Fund expenditures exceeded receipts in 2001, and the shortfall has been made up with transfers from the General Fund.
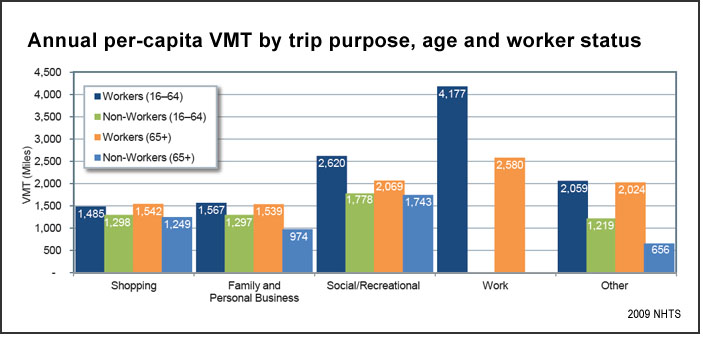
4. Motor vehicle trips by age, worker status and purpose
The DOT report has a useful section on “five myths and facts about daily travel.” One is the general perception that “the majority of personal travel is for commuting to work.” In fact, the report finds that only 16% of trips and 28% of vehicle miles are for work purposes. As the graph below shows, by far the largest component of travel is for social or recreational purposes, with even those of working age driving more for non-work purposes than they do to get to their jobs.
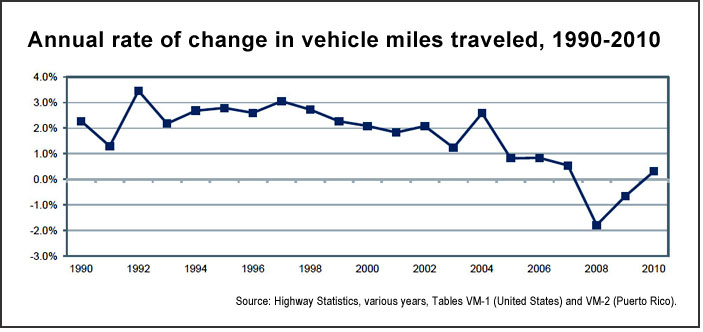
5. Rate of change in vehicle miles traveled in the United States
The DOT report shows that vehicle miles traveled have been on a slightly downward trend since 1997, with an actual reduction in VMT in 2008 and 2009. While the DOT registered an 0.31% increase in VMT between 2009 and 2010, more recent data show that the downward trend has continued. The Federal Highway Commission’s December 2013 Traffic Volume Trends report showed a 1.3% decrease compared to 2012, and adjusted for population, the U.S. VMT is at the same level as in January 1995. Factors in the shift include the country’s lingering economic troubles as well as the seeming declining interest of millennials in cars.
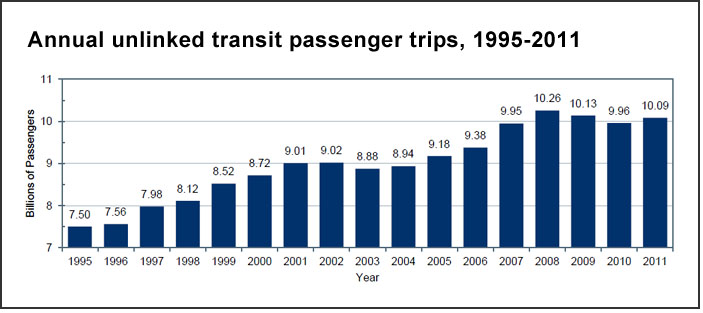
6. Transit passenger trips, 1995-2011
As the rate of change of vehicle miles traveled has decreased and shifted into the negative, so the number of transit trips have shown a general pattern of increase. The DOT found “steady growth” of U.S. transit system coverage, capacity and use between 2000 and 2010. Of note: While commuter rail systems provide just 4.6% of trips, they make up 20% of passenger miles due to greater average trip length. The fastest-growing mode is light rail, with passenger miles traveled (PMT) increasing 5% per year between 2000 and 2010.
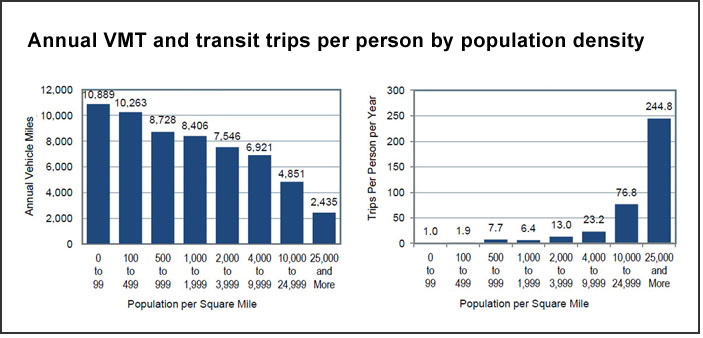
7. Relationship between population density, VMT and transit use
Two charts related to population density show its effect on vehicle miles traveled and transit trips. As population density rises, VMT falls slowly, then drops off sharply at 10,000 people per square mile and above. The inverse relationship holds with transit trips, which rise slowly with density, and then more than triple when population exceeds 25,000 per square mile. Walking trips follow a similar pattern, rising from just 84 per person per year in the least-dense areas to 439 annually in the most compact developments.
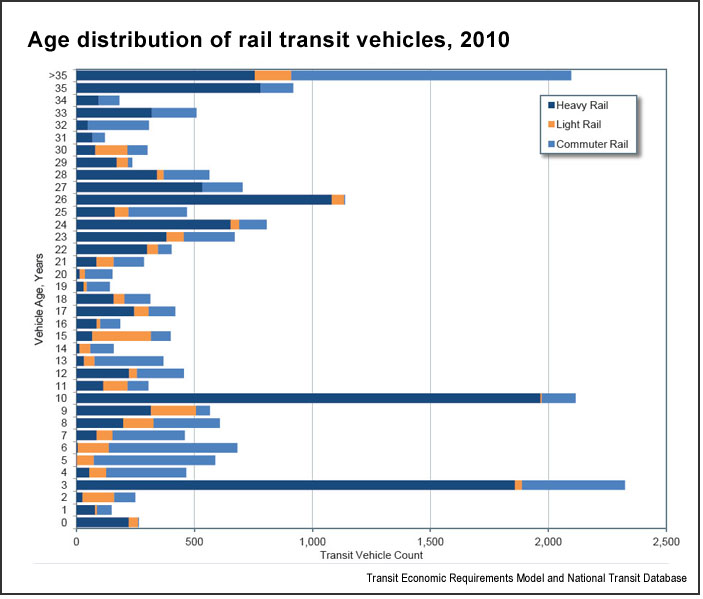
9. Age distribution of rail vehicles, 2010
The age distribution of U.S. rail vehicles shows great disparities. Many are 10 or fewer years old, while more than 2,000 have been in service for 35 years or more. This is in part a reflection of their initial expense and intended lifespan, but also a consequence of longstanding underinvestment in large urban transit systems — the majority of the longest-serving vehicles are for commuter-rail systems.
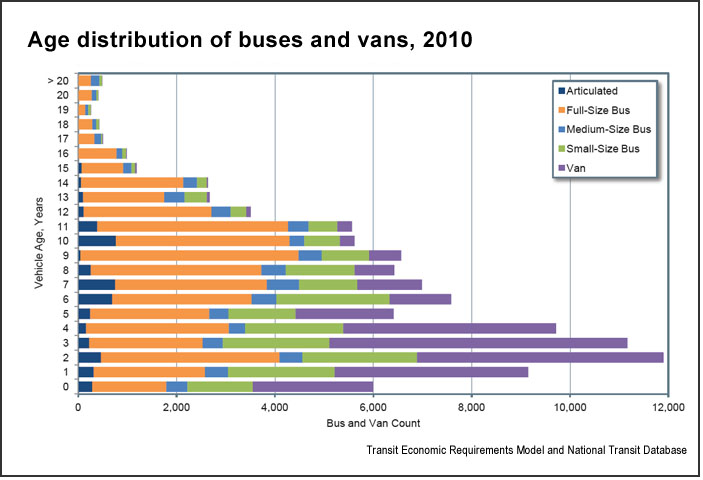
9. Age distribution of buses and vans, 2010
By contrast, the vast majority of buses and vans are less than 12 years old. Full-size buses have a longer service life, and represent a dominant proportion of all vehicles older than eight years. The effect of the 2007-2008 financial crisis is evident, as the number of vehicles purchased and put into service in 2009 and 2010 was considerably below that of earlier years.
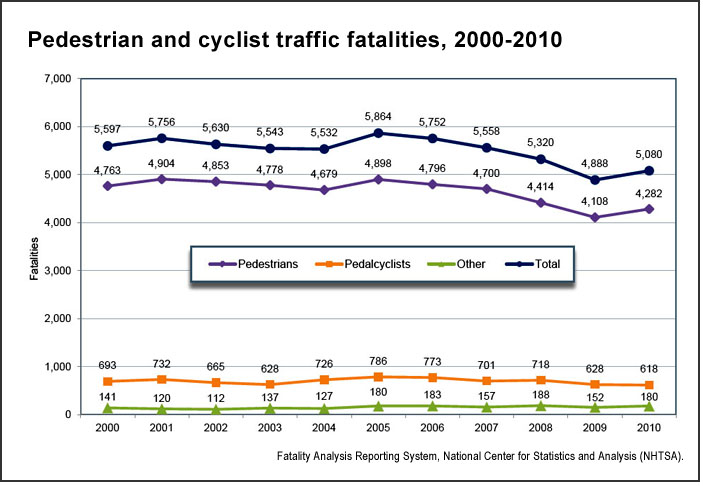
10. Traffic fatalities, 2000-2010
As with all complex publications, care should be taken when choosing isolated statistics from the DOT report. Its primary graphic on U.S. highway transportation safety justifiably notes the improvement between 2000 and 2010, when the number of fatalities per 100 million vehicle miles traveled (VMT) fell from 1.53 to 1.11, a decrease of 28% over 10 years. However, a July 2013 report from the National Highway Traffic Safety Administration found that the downward trend reversed in 2012, with 33,561 fatalities on U.S. roads, an increase of 3.3% over 32,479 who died in 2011. Moreover, as the New York Times noted in a November 2013 story, “motorcyclist and pedestrian deaths each increased for the third year in a row, and deaths of bicyclists reached the highest level in six years.” The following graph from the DOT report shows the beginnings of the trends noted in the Times story, with pedestrian fatalities rising nearly 4% between 2009 and 2010.
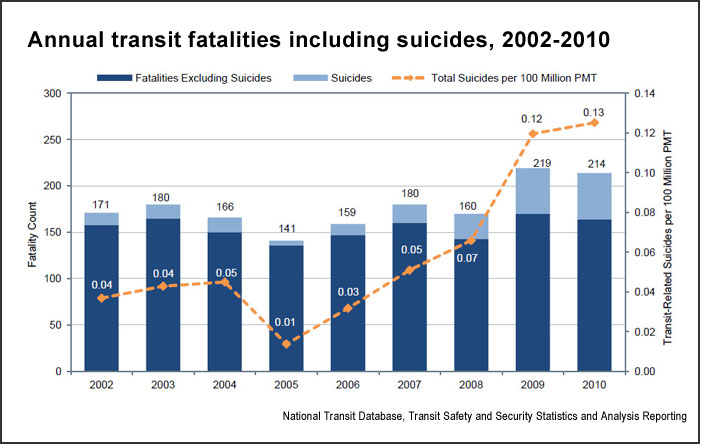
11. Transit-related fatalities, 2002-2010
Reflecting the greater overall safety of mass transit, the absolute number of deaths excluding suicide remained relatively stable from 2002 to 2010 — a little over 150 per year — despite the number of passenger trips over that time period more than doubling. Based on the DOT’s data, in 2010 the fatality rate per passenger trip is approximately 0.0000016%. The number of suicides appears to have risen, but this may be due to improved record-keeping; on average, 75% of these are neither transit passengers nor patrons.
A good source for comparative transportation safety data is a 2013 study from Northeastern University, “Comparing the Fatality Risks in United States Transportation Across Modes and Over Time.” It found that transportation-related fatalities constitute nearly 2% of the 2.43 million deaths per year from all causes in the United States, or 1 in 56. While U.S. travel is considerably safer now than it was in the 1970s, between 2000 and 2009, an average of 43,239 people died every year in transportation-related incidents. Of these, 36,849 were operators of private cars on U.S. roads and highways.
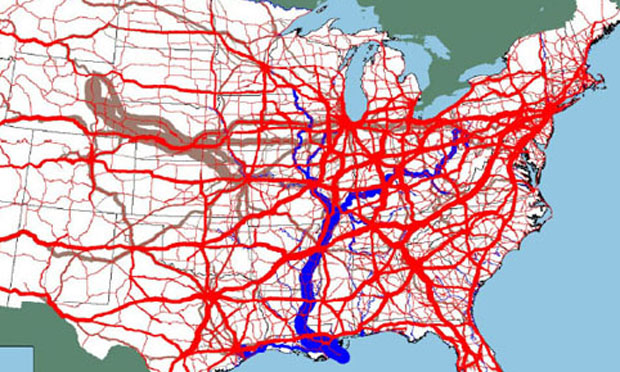
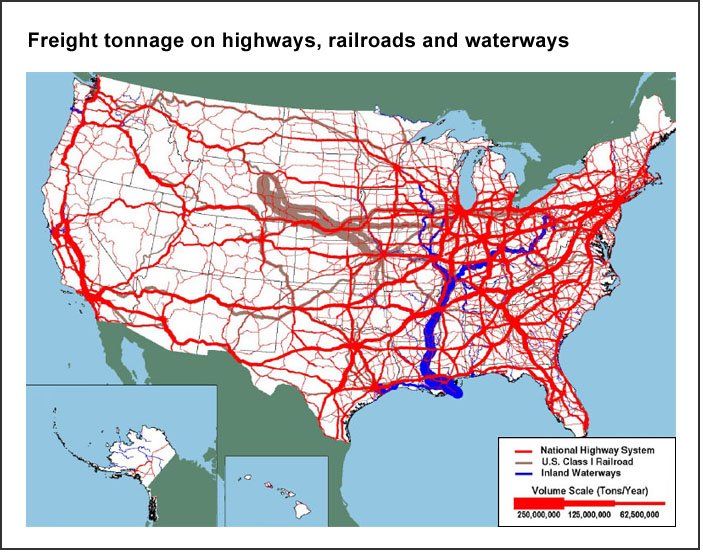
12. Freight tonnage on highways, railroads and waterways
The United States has one of the most active freight systems in the world, particularly rail freight. The DOT included a striking graphic on the flow of all this tonnage. It borrows something from Charles Minard’s classic 1861 depiction of Napolean’s disastrous Moscow campaign. Here, tonnage is shown by line thickness and freight mode by color.
Related research: A 2013 study in the Journal of Economic Surveys, “What Have We Learned from 30 Years of Research on the Productivity of Public Capital?” analyzes the impact of public-capital investments on productivity — the way infrastructure spending affects economic growth in developed nations. The scholars found that “the average output elasticity of public capital amounts to 0.106, after correcting for publication bias.” Thus for every $10 of investment by the national government, productivity increases an additional $1.06. This in turn implies a marginal return of public capital of about 16%, a hefty payback on investment.
Keywords: transportation, traffic safety, driving, cars, @leightonwalter, @journoresource

Expert Commentary