
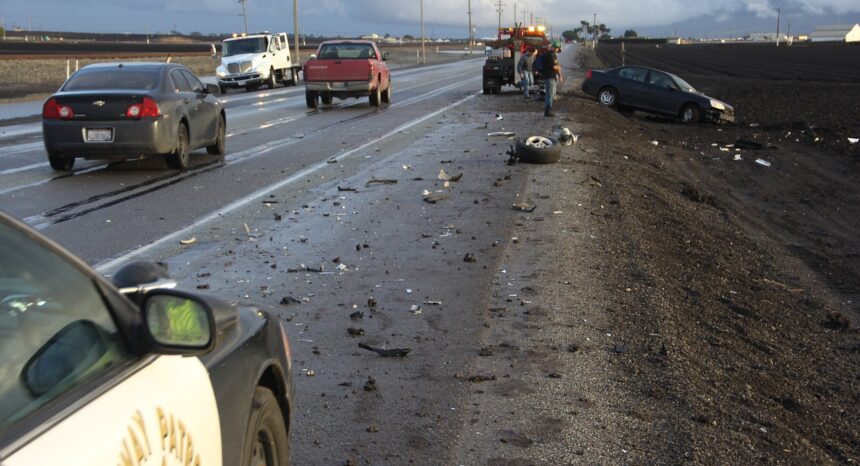


In May 2013 the National Highway Traffic Safety Adminstration released estimates of U.S. traffic fatalities for 2012, and the results were troubling: 34,080 people died in motor-vehicles crashes that year, an increase of 5.3% over 2011’s total and a reversal of the long-term downward trends. The meaning of the one-year shift is unclear and there is a great deal of nuance within all the numbers, but the litany of deaths remains sobering — an average of more than 93 every day.
The lowest year in recent history was 2011, when 32,367 people died on U.S. roads and highways. As horrifying as that number is, it actually constitutes progress: In 1994, 40,716 died on the roads — 26% more, and nearly 112 deaths per day. Beyond the absolute numbers, progress has been made in overall mortality rates: 1.1 per 100 million vehicle miles travelled in 2011 (it rose to 1.16 in 2012). Much of this is due to advances in vehicle safety — air bags, anti-lock brakes and increased crashworthiness. But technology can have its drawbacks as well: Since 1980 the average horsepower of U.S. cars more than doubled, and speed limits have risen significantly, greatly increasing the potential for damage, loss of life and injuries. Motorcycling is also on the rise, and fatality rates have increased in lockstep with its popularity and inherent riskiness.
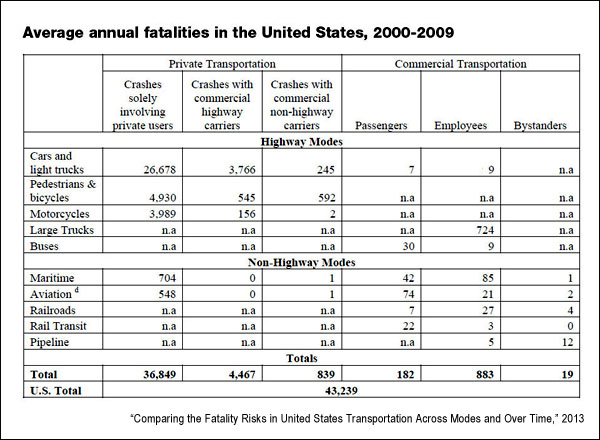
A 2013 study in Research in Transportation Economics, “Comparing the Fatality Risks in United States Transportation Across Modes and Over Time,” looks at the historical trends to paint a fuller picture of where this all stands. The researcher, Ian Savage of Northwestern University, prefaces his findings with an important caveat on measures of “safety”:
The focus on fatalities is primarily motivated by a greater confidence that this measure of safety is reported more consistently and accurately across modes and time. In general, cross-sectional and time-series comparisons in fatalities are also indicative of differences in non-fatal injuries, illnesses, and property damage. Albeit that the correlation is not perfect. In particular, fatalities are a poor measure of some of the environmental risks associated with the transportation of oil products and hazardous materials. In addition many of the advances in safety in recent decades have focused on “crashworthiness” whereby design changes have been made to increase the survivability of crashes and mitigate the severity of injuries. Consequently it is possible that a reduction in fatalities may be partly compensated for by an increase in the number of injuries.
Savage’s analysis involved two datasets: The first involved the relative risk of different travel modes — cars, buses, planes, trains, and more — from 2000 to 2009; the second was a time-series analysis for each mode from 1975 to 2010. The findings of the study include:
- Between 2000 and 2009, on average 43,239 people in the United States died each year in transportation-related incidents. Based on the average number of U.S. residents over that period, the annual risk of dying in a transportation-related accident is 1 in 6,800.
- Transportation-related fatalities constituted just under 2% of the 2.43 million deaths per year from all causes in the United States, or 1 in 56. Transportation was the biggest source of all “unintentional injury deaths” (38%) — those not caused by old age, disease, suicide or homicide.
- Whatever the vehicle, highways are by far the most common place of transportation fatalities in the United States: 94%. If deaths that take place at rail-highway grade crossings are included, the total is even higher, at just over 95%.
- Despite significant fatality rates for highway travel, overall transportation is becoming less dangerous: “The rate in 2010 is just one-third of that in 1975 (1.11 versus 3.35 fatalities per 100 million vehicle miles). The 1980s and early 1990s were the era of the greatest rate of improvement.”
Cars, trucks and SUVs
- Nearly three-quarters of people who died in highway crashes (74%) were occupants of automobiles and light trucks. More than half (55%) occurred in single-vehicle incidents without a prior collision, including roll-overs; vehicles striking fixed objects, animals or debris; or catching fire.
- The proportion of fatal single-vehicle crashes is much higher for light trucks (66%) than it is for automobiles (47%). Light trucks — including minivans, pickups and SUVs — often have a relatively higher center of gravity and thus a greater propensity to roll over.
- Drivers or passengers in cars or light trucks faced a fatality risk of 7.3 per billion passenger-miles: “A person who was in a motor vehicle for 30 miles every day for a year faced a fatality risk of about 1 in 12,500. Relative to mainline trains, buses and commercial aviation the risk was 17, 67, and 112 times greater, respectively.”
- Because private individuals operate the vast majority of motor vehicles, their risk is highly dependent on personal behavior: “Unlike the commercial modes where passengers are victimized randomly, the risk to individual highway users varies considerably depending on age, alcohol consumption and the type of road used.” (See highway risk factors below.)
- “One might argue that transportation equipment, and in particular the motor vehicle, must be the most dangerous machines that we interact with on a daily basis,” the researcher states. “The annual toll in motor vehicle crashes exceeds the deaths resulting from the next most dangerous mechanical device, firearms, by about 40%.”
Motorcycles
- Nearly 10% of all highway fatalities — one in ten — were motorcyclists: “When a motorcycle is involved in a collision with another vehicle, the motorcyclist invariably receives more serious injuries. The ratio of fatalities in two-vehicle collisions was 70 motorcyclist fatalities for each fatal injury sustained by the occupant of the other vehicle.”
- Over the period studied, motorcycles became increasingly popular, with use rising as much as 75%. As a consequence, fatalities have increased proportionally. This trend has been exacerbated by the “general rollback in the number of states requiring motorcycle riders to wear helmets.” (Earlier research has indicated that when a state repeals or weakens a helmet-use law, motorcyclist fatalities typically rise nearly 40%.)
- Motorcycles had a fatality rate of 212 per billion passenger miles, by far the highest of all modes: “A motorcyclist who traveled 15 miles every day for a year, had an astonishing 1 in 860 chance of dying — 29 times the risk for automobiles and light trucks.”
Highway risk factors
- Urban roads are far safer than those in rural areas: “Based on data from 2009, highways in rural areas have a fatality risk that is 2.7 times greater than that in urban areas. In general the lower average speeds, greater provision of lighting, greater deployment of traffic control devices and fewer curves in urban areas more than compensate for factors such as the greater number of intersections and the presence of pedestrians.”
- Gender and youth play are significant factors in fatality risk: Males are three times more likely to die in a road accident than females, while people between the ages of 18 and 29 are at a 50% to 90% greater risk.
- Seat-belt use is a significant factor: Half of vehicle occupants who die in automobiles and light truck incidents (49%) were not wearing seat belts or using child safety seats.
- Alcohol played a role in approximately a third of all highway fatalities, with at least one of the involved parties having a blood-alcohol level above 0.8 grams per deciliter.
- Related research has shown that drivers using cell phones show greater impairment than drunk drivers, and hands-free systems offered no improvement over handheld devices. Cell-phone conversations have a more profound effect on driver performance than other forms of in-car distraction, including talking to passengers and listening to the radio.
Trains
- Mainline railroads claimed an average of 876 lives a year, the majority of which occur during collisions with highway users and pedestrians. The largest number of deaths, 490, involve people and vehicles not at grade crossings, and a significant portion of those deaths, approximately 85 to 110, were possibly suicides.
- The balance of rail-related deaths involve motorists at grade crossings (281), pedestrians at grade crossings (68) employees and contractors working on the tracks (26). Per year on average, only seven passengers traveling on mainline trains die.
- The overall fatality rate for long-haul train service is 0.43 per billion passenger miles. Excluding pedestrians and others not on trains — 64% of total fatalities assigned to railroads — the fatality rate is approximately 0.15 per billion passenger miles.
Buses
- Vehicles with a capacity of 10 passengers or more represented just 0.1% of the total fatalities. On average, there were approximately 40 fatalities per year, with drivers and other bus-company employees representing 25% of lives lost.
- Scheduled and charter service accounted for 44% of total bus fatalities. The balance of deaths occurred with school buses (23%), urban transit (11%) and a variety of private shuttles, church buses and other services (22%).
- The fatality rate per billion passenger-miles for buses is relatively low, 0.11. However, this is still 65% greater than that for aviation, and doesn’t include victims of crime. (Also, see statistics on “curbside” bus services.)
Airlines
- The majority of aviation fatalities that occur each year (85%) involved private aircraft (known as “general aviation”). On average, 549 people die each year in activities such as recreational flying (41% of flight hours), business travel (24%), and instruction (17%).
- Excluding acts of suicide and terrorism, commercial aviation was the safest mode of travel in the United States, with 0.07 fatalities per billion passenger miles: “A person who took a 500-mile flight every single day for a year, would have a fatality risk of 1 in 85,000.” (One variable to note: Takeoffs and landings are where the risk is, not in the number of miles flown, so risk-per-flight calculations are higher.)
Walking, bicycling
- Between 2000 and 2009, on average 6,067 pedestrians and bicyclists died on U.S. highways and in collisions with other modes of transport. Of these, 4,930 died when hit by cars and trucks operated by private users, 545 deaths resulted from collisions with commercial carriers, and 592 from commercial users not on highways.
- In all, fatalities of pedestrians and bicyclists make up nearly 15% of annual average highway fatalities. More than 90% of pedestrian fatalities occurred when the victims were hit by automobiles and light trucks.
- A related study on risk factors for on-road cycling commuters indicated that prior to car-bicycle accidents, 89% of cyclists were traveled in a safe and legal manner. In addition, vehicle drivers were at fault in 87% of the events.
A related 2013 study published in the Annals of Emergency Medicine, “Safety in Numbers: Are Major Cities the Safest Places in the United States?” examined the overall injury risk in urban areas compared with suburban and rural areas. Among the conclusions: Rural counties demonstrated significantly higher death rates than urban counties — 1.22 times greater for the most rural compared with the most urban. The majority of the difference was in unintentional incidents such as accidents, but some increase in suicide risk was also seen in rural areas. Overall, the study finds, “U.S. urban counties were safer than their rural counterparts, and injury death risk increased steadily as counties became more rural.”
Also of interest is a 2013 report by the World Health Organization. “Global Status Report on Road Safety 2013: Supporting a Decade of Action.” The study was based on country-level data and included information on newer risk factors such as cell phone use while driving. Among the findings, the report states that more than 1.24 million people die every year as a result of road traffic injuries, making it the eighth leading cause of death globally, and the leading cause of death for young people aged 15-29. Based on anticipated trends, by 2030 road accidents are projected to be the fifth leading cause of death globally.
Keywords: cars, trains, Amtrak, Northeast Corridor, planes, airlines, pedestrians, bicycling, safety, distracted driving, alcohol, multitasking, driving
Expert Commentary