

On April 22, 2016 — the day we recognize as Earth Day — more than 130 countries are scheduled to be in New York to begin signing the landmark Paris climate change agreement, as part of the United Nations Framework Convention on Climate Change (UNFCCC). The agreement will enter into force soon after it is signed by at least 55 nations representing at least 55 percent of annual global greenhouse gas emissions.
Countries have made individual commitments to reduce greenhouse gas emissions, and over the coming years will report their progress on meeting these goals. For details, see the World Resources Institute’s useful CAIT Climate Data Explorer, and check out the Carbon Footprint of Nations project, from the Norwegian University of Science and Technology, to find comparative data.
News stories frequently focus on impacts — changing environmental and seasonal patterns, extreme weather, wildfires and drought fueled by climatic change. But the process of stopping global warming can seem a nebulous and abstract concept for news audiences, and it is not always easy to “localize” and make tangible the stakes for citizens in terms of mitigating climate change through reduced greenhouse gas emissions.
The Society of Environmental Journalists (SEJ) has useful tips on covering a variety of topics relating to climate change. The Poynter Institute has an online class on covering climate change. And the Metcalfe Institute for Marine & Environmental Reporting at the University of Rhode Island produced an essential guide for reporters and other communicators. Journalist’s Resource also has tip sheets on the underlying scientific research, as well as on topics such as when to use “global warming” versus “climate change.”
The following are tools and sources to help journalists localize the story of emissions reductions:
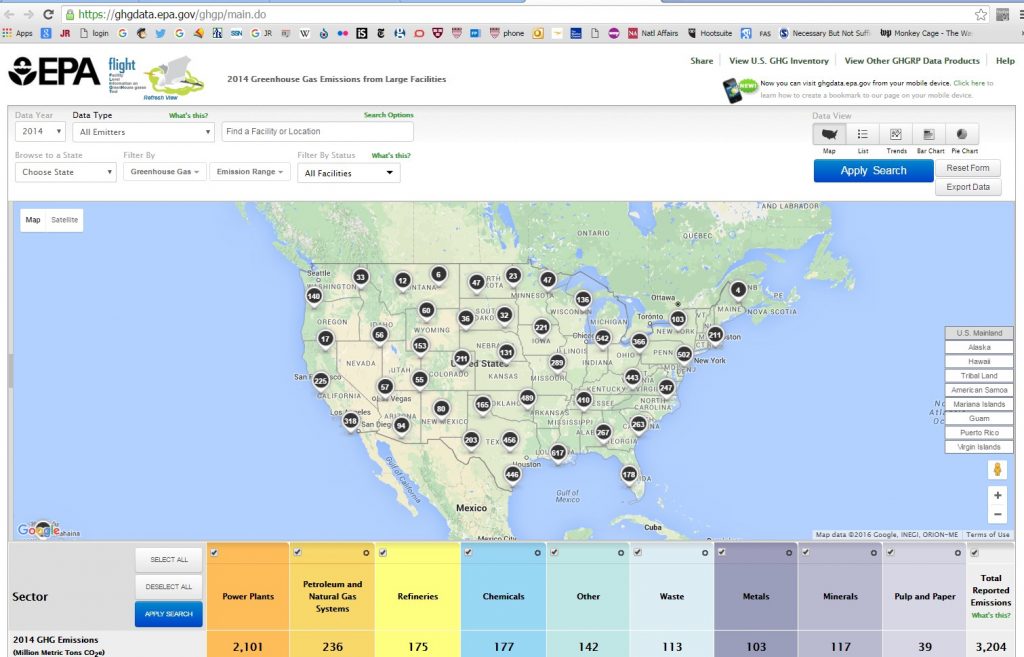
Large facilities in your state:
The U.S. Environmental Protection Agency (EPA) has launched an interactive data tool to locate the large power-producing facilities in your state, as well as other industrial facilities that yield large amounts of greenhouse gases. You can find data relating to the metric tonnage of greenhouse gas emissions that each facility produces. Reporters could extract and map this data to help show local contributions to the larger problem.
Public companies in your state:
The environmental group Ceres has created a searchable database so you can find the climate change-related disclosures of many publicly traded companies. These disclosures come as part of filings with the Securities and Exchange Commission and often relate to clean energy, renewable or company policies on climate risks.
Opinions on climate change in your state
The Yale Project on Climate Change Communication has put together an interactive tool to show how citizen beliefs about climate change vary locally and regionally. For context, see this 2015 study published in the journal Nature Climate Change.
How your state compares to others:
The federal Energy Information Administration provides insights on state-level trends over time and has available accessible graphics and charts that can help audiences see, for example, how per-person emissions vary by geographical area across the United States, as well as the highest emitting states.
Household carbon footprint
The EPA also has a calculator for citizens to look at the total impact of their particular mix of energy usage based on their household. Reporters could use the tool to show audiences how to explore the typical profile of different kinds of households in their region, tailored to zip codes. (Environmental groups such as The Nature Conservancy and the World Wildlife Fund also have calculators for individuals.)
Cars and greenhouse gas emissions
Fueleconomy.gov allows visitors to calculate the efficiency of different cars and allows side-by-side comparisons. Because different kinds of vehicles are more popular in certain U.S. regions, reporters could localize and tailor this data according to certain makes and models.
Expert Commentary