


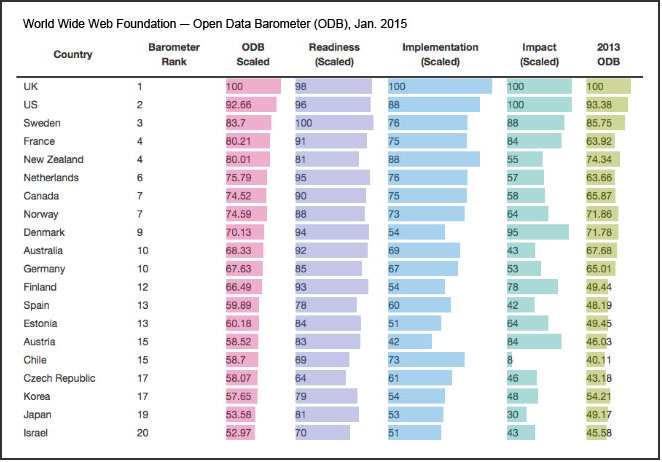
In January 2015 the World Wide Web Foundation — started by Web pioneer Tim Berners-Lee — issued its second “Open Data Barometer Global Report,” which ranks countries based on the quality of access to government data and related measurements. That and other international efforts toward fostering a culture of open government data — including the 2013 G8 summit’s publication of the Open Data Charter — have accelerated a movement pressing for societies to become more transparent, with implications for everything from electoral integrity to control of corruption.
In this age of digital communications, it has never been easier for U.S. citizens to access government information, from the federal government’s own Open Government Initiative and Project Open Data; to state, county and city data hubs; to NGO efforts such as the work of the Sunlight Foundation and the Texas Tribune’s government salaries explorer. At the same time, governments and agencies at all levels often lag in their degree of openness, raising concerns about citizens’ access to vital information.
The theory goes that increased transparency allows citizens to more accurately judge the performance of their government and thus reward or punish elected officials at the ballot box. But it’s not just about elections and accountability; it’s also about improving the quality of services. A 2014 paper by the Harvard Kennedy School’s Archon Fung and Stephen Kosack of the University of Washington examined 66 studies of transparency initiatives in the developed and developing world. The scholars selected 16 for deeper analysis, and found that initiatives were most effective in situations where there were competitive services, allowing citizens to use information generated through government transparency to select higher quality services.
The consequences of increased government transparency may not be uniformly positive, however — for example they can raise issues of public trust and privacy. Even transparency proponents such as Fung have written about its potential downsides, including “naked government,” where attention is focused on areas where the government is under-performing, without increasing awareness of positive government performance. Such concerns are serious, given how much the American public’s trust in their government has already declined, even as transparency has increased.
One key issue in this evolving field remains how to measure transparency accurately across societies, in order to compare them properly. The freedom of the press is one commonly used proxy as an indication of openness, particularly as indicated by newspaper circulation. However, measures such as the Freedom House Press Freedom Index have several potential drawbacks, including their use of subjective measures and limited ability to compare countries over time. Other proxies for government transparency are legal or institutional mechanisms that allow citizens to access government information, such as freedom of information laws.
A 2014 study published in the journal Political Analysis, “Measuring Transparency,” focuses on measuring a particular type of transparency — the collection and dissemination of government data. The authors, James Hollyer, Peter Rosendorff and James Vreeland, from the University of Minnesota, New York University, and Georgetown University, respectively, use the World Bank’s World Development Indicators (WDIs) as a measure of governments’ efforts to collect and disseminate data. The study looks at the reporting or non-reporting of the indicators, a “valid indicator of governments’ efforts to collect and disseminate economically relevant information.”
With this data the authors construct transparency measures for 125 countries covering the period from 1980 to 2010, which they refer to as the “HRV index” (which takes its name from their initials). It reflects 240 of the 1,265 WDIs, selected for consistency of collection across all countries for the entire time period. The key benefit of the HRV index is its reporting of aggregate economic data, as government policies are often best judged by how they affect the welfare of the entire population. The data also has a built-in quality control because the World Bank may define data as missing, even if provided, if it deems the data questionable.
Key findings include:
- The HRV index appears to be a good measure of political will toward transparency — the government data that shows the greatest variability in terms of reporting are also those that relate to the most politically sensitive parts of the economy, notably trade and investment. Less controversial information, such as population statistics, shows less variation.
- The countries at the top of the HRV index are all part of the OECD — South Korea, Spain, Sweden, Japan and Finland. The lowest-scoring countries are Russia, Cambodia, Guinea, Laos, Mongolia and Guinea-Bissau — all states that would be expected to score poorly on transparency during this period.
- A number of countries show unexpected levels of variation, including Belgium and Denmark. The authors attribute this in part to the introduction of the euro, and its associated new reporting environments.
- In some cases the HRV index closely follows political and economic developments. For example, Tanzania was a single-party state in the 1970s and 1980s. In 1992 multiparty elections were introduced and the state began to open up its economy in the early 1990s. This is tracked by significant upward shifts in the transparency in 1990, followed by further improvements during the rest of the decade.
- The HRV index was compared directly with newspaper circulation as a proxy for transparency against three other measures of governance: bureaucratic quality, the rule of law and corruption levels. Whereas newspaper circulation was found to be associated with improved governance only under democracy (where the press is presumably free), the transparency index performs well at measuring improved governance in non-democracies: “Data dissemination is strongly linked to the quality of governance in autocracies.”
- “The HRV index is more strongly correlated with bureaucratic quality and law and order than is newspaper circulation, in all but the most democratic states. Neither measure of transparency is highly correlated with the level of corruption — the HRV index outperforms newspaper circulation in nondemocracies, and newspaper circulation is a better predictor of corruption in democracies.”
- While data collection and dissemination are sometimes influenced by factors beyond government control — for example, a country’s level of economic development and associated government capacity — even after controlling for countries’ GDP per capita, more democratic nations appeared to gather and disclose more data than more autocratic countries.
The scholars conclude that “the HRV provides information on a far wider range of countries and dates than do alternative transparency measures. Moreover, it captures a largely unmeasured form of transparency of great theoretical import.”
Related research: The Transparency Policy Project, at the Ash Center for Democratic Governance and Innovation at Harvard Kennedy School, analyzes transparency policies of all kinds and looks at the complex dynamics around them. Transparency International focuses on measures of corruption across different areas within countries. And the Edmond J. Safra Center for Ethics at Harvard has a wide variety of research projects that examine issues around transparency in government and law, among other areas. See the more than 500 papers produced by center fellows and affiliates.
Keywords: transparency, government, accountability, democracy, index, corruption
Expert Commentary