
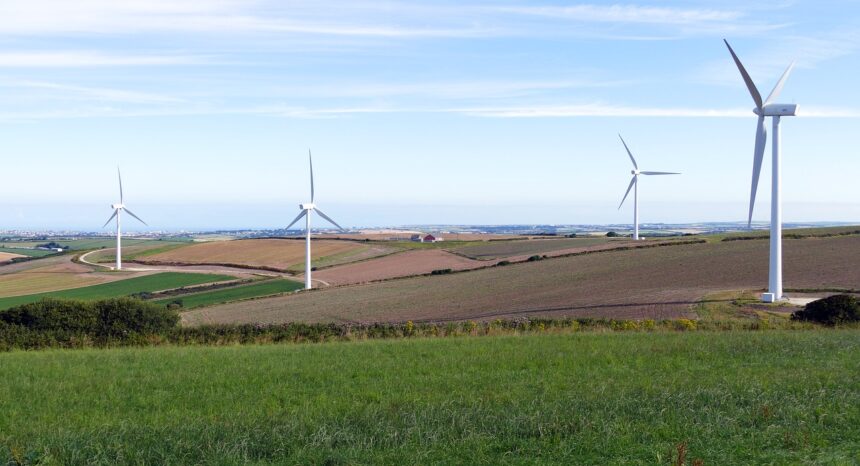

In August 2015, the U.S. Environmental Protection Agency announced its new Clean Power Plan, which includes the first national standards for reducing carbon pollution from power plants. The plan requires states to reduce carbon-dioxide emission rates, while allowing flexibility in how the goals are achieved. For example, states could employ a mix of improving the efficiency of existing generation capacity, reducing demand through conservation methods, and, of course, increasing the proportion of electricity obtained from less carbon-intensive fuel sources.
Shortly before the plan was finalized, the U.S. Energy Information Agency released a detailed analysis of the plan’s probable impacts. The agency found that switching generation capacity from coal to natural gas was likely to be the dominant strategy employed by states, with a significant reduction in annual emissions — up to 625 million fewer metric tons of CO2 in 2030, depending on the scenario. Wind and solar are expected to play a “growing role” by the mid-2020s, and by 2030 would generate more than 400 billion kilowatt hours of electricity annually.
While renewables have long faced the challenge of providing backup capacity — fossil-fuel and nuclear plants currently play that role — a 2015 study in Nature Climate Change indicates that battery technology is advancing more rapidly than anticipated. In May the electric car manufacturer Tesla announced it was developing a battery system intended to store power generated from household solar during the day for nighttime use.
A key question with respect to renewable energy growth is the greenhouse gas emissions associated with specific technologies. While renewable power sources are themselves carbon-free — it’s just sunlight, wind and water, after all — the components and facilities have to be manufactured, built, and maintained, and at the end of their lives, plants must be retired or replaced, and their components disposed of or recycled. A landmark 2008 study in Energy Policy examined nuclear power from this perspective and found that the mean value of CO2 emissions over a reactor’s lifetime was 66 grams per kilowatt-hour of electricity — less than the best fossil fuel (natural gas), but more than the most carbon-intensive renewable (biomass).
A 2014 research review and meta-analysis published in Energy Policy, “Assessing the Lifecycle Greenhouse Gas Emissions from Solar PV and Wind Energy: A Critical Meta-Survey,” tackles this question for renewables. The authors were Daniel Nugent and Benjamin K. Sovacool of Vermont Law School; Sovacool is also at Aarhus University in Denmark and authored the 2008 nuclear-power study. In their research, they examined more than 153 studies on the life-cycle CO2 emissions of a range of wind and solar photovoltaic (PV) technologies, and selected 41 for deeper analysis, allowing the scholars to better understand the emissions of current technologies as well as pinpoint where emissions occur and under what circumstances, and thus how they might be reduced. All the studies chosen for inclusion were peer-reviewed and more than 70% were published within the last five years.
The metastudy’s key findings include:
- Based on the studies examined, wind energy emits an average of 34.11 grams of CO2 per kWh over its lifetime, with a low estimate of 0.4 grams and a high estimate of 364.8 grams. The mean value for solar PV is 49.91 grams of CO2 per kWh, with a low estimate of 1 gram and a high estimate of 218 grams. The large ranges in the estimates were due to factors such as resource inputs, technology, location, sizing and capacity and longevity, as well different calculation methods used by source studies.
- The sources of energy used to manufacture components can be critical: “The same manufacturing process in Germany would result in less than half of the total emissions that such a process would entail in China. This was primarily due to China’s significantly greater dependence on black coal for electricity production in comparison with Germany’s much greater reliance on natural gas and nuclear power.” (The same issue plays into the lifetime emissions of electric cars.)
- The “material cultivation and fabrication stage” of renewable-energy facilities was responsible for the greatest proportion of emissions — just over 71% for both solar PV and wind. Facility construction and related transportation were responsible for 24% of wind’s lifetime CO2 emissions and 19% for solar PV, while operation contributed 19.4% of wind farms’ lifetime emissions and 13% for solar.
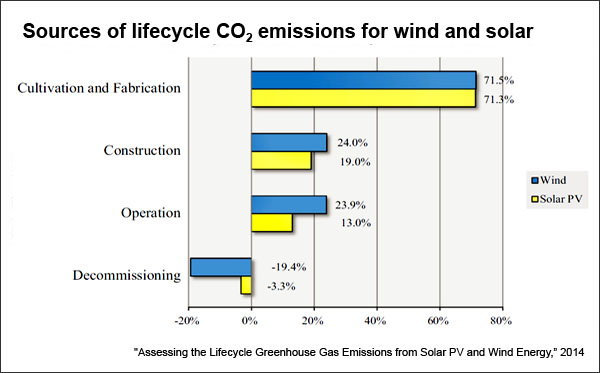
- Decommissioning or reuse was a net gain for both solar and wind, offsetting the equivalent of 19.4% of a wind farm’s lifetime emissions and 3.3% of a solar PV facility’s. This is because “reclamation is not a standard practice for wind energy (the pads are often left or reused), and a majority of the steel towers, plastics, and fiberglass blades are recyclable.” These practices allow future emissions to be avoided.
- On average, larger wind turbines were found to have lower lifetime emissions per kWh than smaller ones: “Higher capacity wind turbines, both with taller hub heights and larger rotor diameters, correspond to lower GHG intensities. Tremeac and Meunier (2009) compared a 4.5 MW turbine to a 250W version and found the smaller to have a GHG intensity equal to approximately three times greater than the larger turbine.”
- Solar GHG intensity also fell with increasing size, despite the fact that panels are modular and should theoretically have the same efficiency at all sizes. This was possibly due to gains in transportation and logistics.
- Lifetime emissions decreased substantially as lifespan increased: Studies that assumed a 20-year turbine life resulted in an average of 40.69 grams per kWh, falling to 28.53 grams for 25 years and 25.33 grams for 30 years. Solar followed a similar pattern, with an even sharper drop over time, from 106.25 grams per kWh for five years to 17.5 grams per kWh over 20 years.
“By spotlighting the lifecycle stages and physical characteristics of these technologies that are most responsible for emissions, improvements can be made to lower their carbon footprint,” the authors state. Looking forward, they recommend that future studies should be more methodologically rigorous, and that key questions such as the impact of energy storage on lifetime emissions be examined.
Related research: A 2015 report in the Annual Review of Environment and Resources, “Opportunities for and Alternatives to Global Climate Regimes Post-Kyoto,” compares international policies for mitigation of climate change to the Kyoto Protocol. A 2014 study in Renewable Energy, “How Does Wind Farm Performance Decline with Age?” examined the long-term performance of 282 wind farms in the United Kingdom.
Keywords: renewable energy, wind power, solar power, solar photovoltaics, lifecycle assessment, metastudy, greenhouse gases, climate change
Expert Commentary