


From the Scholars Strategy Network, written by Peter D. Howe, Utah State University, and Matto Mildenberger and Jennifer R. Marlon, Yale University
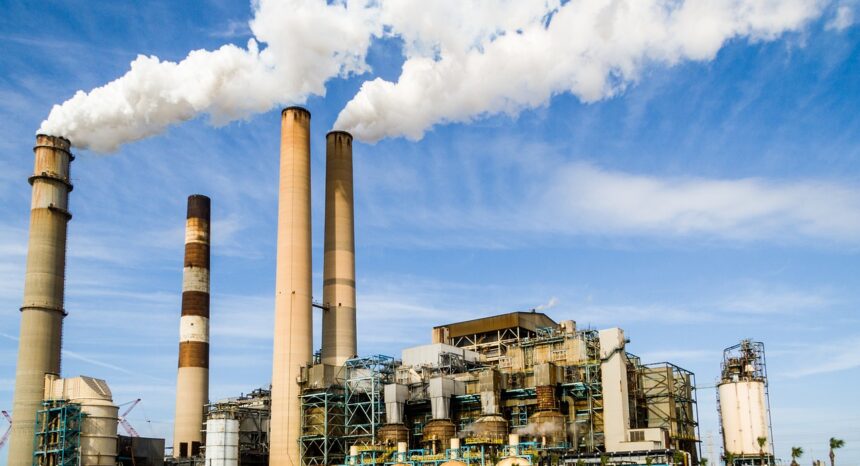
Responding to the climate threat will take an all-hands-on-deck approach that combines policies at the national level with coordinated actions by state and local governments. To support climate policymaking, climate scientists create detailed models of climate change risks at the local level. But fashioning publicly supported responses to climate threats is a major political challenge. As part of any effective response, state and local officials will need to interact with and represent the concerns of diverse constituencies. Policymaking will be shaped by public concerns about climate change, public understanding of the shifts in behavior necessary to manage the threat, and public support for different climate policy options.
To help understand citizen attitudes, we created the “Yale Climate Opinion Maps” — an interactive online tool supported by a peer-reviewed scientific article published in Nature Climate Change. Our online tool provides estimates of what Americans believe about climate change, their perceptions of climate risks and support for policy options, with breakdowns for all 50 states, 435 congressional districts, and 3,000-plus counties in the United States.
Measuring public views
Recent years have brought a proliferation of polls that document national beliefs about climate change with a single number. For example, surveys indicate that 63% of Americans believe that global warming is happening. However, existing polls provide, at best, a limited view of the distribution and variation of opinions at the local scales relevant for many decision makers. Imagine we did a national survey of 2000 Americans that included 50 Americans from the state of Texas. Unfortunately, averaging the responses of these 50 Texans could not provide an accurate estimate of average climate beliefs in Texas — because the Texans who happened to be polled would usually not be a good representation of the range of views held by all Texans. Furthermore, for many smaller areas across the country, such as a rural county, there would not usually be a single respondent from that area in a national poll.
So how can we meet the important need for high-resolution data on local variations in public climate opinion? It would be prohibitively expensive to poll every state, county or congressional district. Fortunately, statisticians have recently developed reliable and accurate methods to take national survey data, and “downscale” this data to local snapshots. The technical name for this method is “multilevel regression and poststratification.” We collected over 13,000 survey responses from polls done by the Yale Project on Climate Change Communication and the George Mason Center for Climate Change Communication. We then built a model using this approach that leveraged this large dataset to provide estimates of popular climate beliefs in all 50 states, all 435 congressional districts, all 3,143 U.S. counties and 381 metropolitan areas.
Our statistical estimates have been validated by advanced statistical tests and independent polls. The research team did independent polls of U.S. residents in four states, California, Texas, Ohio, and Colorado, and in two cities, San Francisco and Columbus. We found that our model closely resembled the poll results. This reassures us that results for other areas are likely accurate too.
What Americans think about climate change and policy responses
We found large differences in climate beliefs and support for different climate policies across the country. For instance, county-level estimates of belief that global warming is happening range from a low of 43% in Trimble County, Kentucky to a high of 80% in New York County, New York. Across the entire country, only 75 counties have fewer than 50% of people who think global warming is happening. But there was substantial variation within states. Although an estimated 70% of all California residents believe that global warming is happening, the county level rates range from 61% in Plumas County to 79% in San Francisco County.
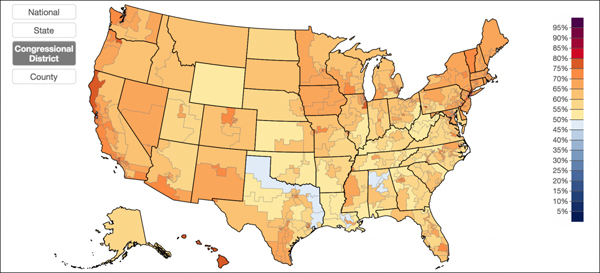
Our data also helps chart differences in policy preferences. For instance, the map included here shows variations in public support for setting strict carbon pollution limits on coal-fired power plants. In the vast majority of congressional districts, the public supports this policy action. Maps such as this one help to show that, very often, elected officials in Washington DC who resist regulations on carbon pollution are not reflecting the views of most of their constituents.
Anyone can explore and use the data we developed, by visiting the online tool we have created. With this tool, citizens and policymakers alike can explore public views about climate and energy issues across the United States, and compare the views of people in particular localities and states to national averages. Our data is also available for free download from the same website.
Related research: Read more in Peter D. Howe, Matto Mildenberger, Jennifer R. Marlon and Anthony Leiserowitz, “Geographic Variation in Opinions on Climate Chance at State and Local Scales in the USA.” Nature Climate Change, April 2015.
The authors are members of the Scholars Strategy Network, where this post originally appeared.
Keywords: global warming, research brief
Expert Commentary