The U.S. economy is on the mend, but the patient appears to still need substantial care. Jobs are being added at a snappy pace — 288,000 in June, with unemployment falling to 6.1% — but GDP growth remains weak, just 2.1%. And after gains in the crucial housing market in 2012 and 2013, construction starts declined 9.3% in June 2014 — not a good sign given housing’s importance to the economy as a whole. These trends affect all communities large and small, and for reporters covering these issues, nuance — and data — matter.
The latest report from Harvard’s Joint Center for Housing Studies, “The State of the Nation’s Housing, 2014,” explores the challenges facing the sector, which on average makes up nearly 5% of U.S. economic activity. The authors see a range of factors holding back housing demand and household formation, including tight credit, lingering unemployment, stagnating wages for those who do have jobs and rising student loan debt. All these in turn are suppressing economic growth.
Among the report’s overall findings:
- The national homeownership rate fell to 65.1%, the ninth consecutive year of decline after it peaked at 69% in 2004. However, the drop was the smallest since 2008, 0.3%, indicating that the overall rate may be stabilizing.
- The long-term decrease in homeownership was sharpest among younger adults: The rate for 25- to 34-year-olds fell nearly 8 percentage points from 2004 to 2013; for those 35- to 44 years old, the decrease was approximately 9 percentage points, and for middle-aged households, 4 percentage points.
- Minority homeownership rates fell disproportionately from 2004 to 2013, dropping 6 percentage points for black households and 4 percentage points for Hispanics and Asians. For whites, the decline was just 3 percentage points.
- At the same time, minorities make up growing a share of the first-time homebuyers: “At last measure in 2011, 32% of all first-time buyers were minorities, with Hispanics alone accounting for 14%. First-time homebuyers are also more likely to be foreign born (16%) compared with current homeowners (10%). This is particularly true among Hispanic households, where 49% of first-time buyers are immigrants.”
- While the share of “underwater” mortgages has fallen significantly, more stringent credit requirements, rising home prices and an increase in interest rates are discouraging potential buyers. The rate for 30-year fixed mortgages rose from 3.6% to 4.4% over 2013, and the average score for Fannie Mae-backed mortgages rose from 694 in 2007 to 751 in 2013.
- Rising student loan debt is putting a significant burden on younger would-be buyers: “Between 2001 and 2010, the share of households aged 25-34 with student loan debt soared from 26% to 39%, with the median amount rising from $10,000 to $15,000 in real terms…. For these borrowers, the need to pay off these outsized loans will likely delay any move to homeownership.”
- Median household income continues to fall, dropping 1.4% in real terms in 2012, the lowest level in nearly two decades. “The steepest declines have been among younger adults. The median income for households aged 25-34 fell an astounding 11% from 2002 to 2012, leaving their real incomes below those of same-aged households in 1972.”
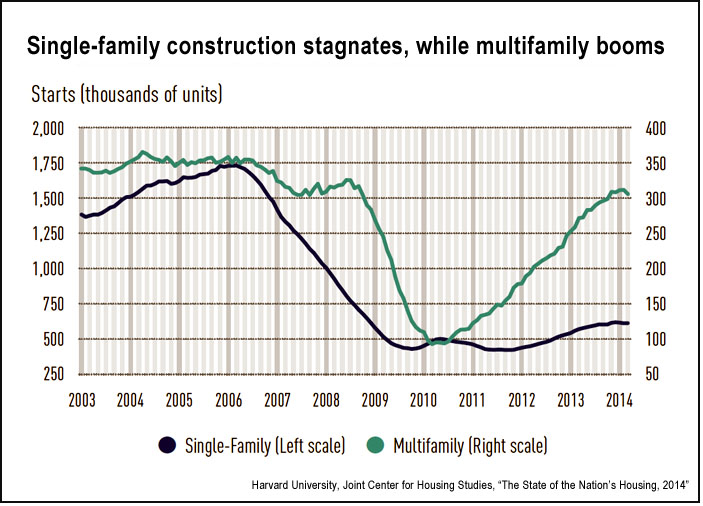
Single-family construction starts have recovered somewhat, while multi-family starts posted their third consecutive year of increases.
- Single-family housing starts are up — there were 925,000 in 2013, an increase of 18.5% over 2012 — but remain far below the long-term average of 1.46 million. Starts have stayed below 1 million for the past six years.
- Single-family permitting rose in 90 of the largest 100 metropolitan areas, but is still 48% below annual averages seen in the 2000s. Notable increases were in Atlanta (up 62%), Los Angeles (52%) and New York City (49%).
- Multifamily construction hit 307,000 units in 2013, an increase of 25% over the prior year, and exceeding the 300,000 level for the first time since 2007. In fact, “following increases of 54% in 2011 and 38% in 2012, last year’s growth in multifamily starts represents a considerable slowdown in activity.”
- Approximately a third of total residential construction, 310,000 units, was intended for the rental market, the highest rental share posted since 1974.
- Strong growth in multi-family construction was seen in cities such as Atlanta, Baltimore and Detroit, while the largest number of permits were issued in New York, Los Angeles and Houston.
Following on trends reported in the Joint Center for Housing Studies’ 2013 report, the number of renters continues to rise. Findings in the new report include:
- Mirroring the continuing decline in homeownership, the demand for rentals remains strong: In 2013, the overall vacancy rate fell to 8.3%, while rents rose 2.8%, exceeding the inflation rate of 1.5%. In the 20 most desirable cities, rents rose more steeply, averaging 6%, quadruple the inflation rate.
- Single-family rentals are on the rise: Between 2006 and 2012, the number of such properties increased by 3.2 million, double the number of new apartments in multi-family buildings. Single-family rentals now make up 34% of the rental stock, an increase of 4% over 2006. Much of this jump was due to unique conditions after the Great Recession, including “a high volume of distressed homes for sale, weak demand from owner-occupants, and high rent-to-price ratios.”
- Rental units are becoming less affordable for many Americans: “The median monthly gross rent for units built in the preceding four years was $1,052 — affordable at the 30%-of-income standard only to households earning at least $42,200 a year.”
- Just over 50% of renters are now considered “cost-burdened,” paying more than 30% of their income for housing; 28% of renters had severe burdens, paying more than 50% of income for housing. Lower-income households are hit particularly hard: “Among those earning less than $15,000 a year (roughly equivalent to working year-round at the federal minimum wage), 82% paid more than 30% of income for housing in 2012 while 69% paid more than half.”
- Being cost-burdened affects households’ overall spending: “In 2012, renters who were severely cost-burdened spent 39% less on food and 65% less on health care compared to similar households living in more-affordable housing.”
- Assistance to burdened households is falling behind rising demand: “The number of households eligible for rental subsidies shot up 21% between 2007 and 2011, growing from 15.9 million to 19.3 million. But only 4.6 million — or just under a quarter — received assistance in 2011.”
- At the same time, rental properties remain highly profitable for owners, with a 10.4% annual rate of return. On average, the price of commercial-grade apartments rose 14% between 2012 and 2013, “exceeding their 2007 peak by 6% and far outpacing the recovery in owner-occupied home prices.”
As boomers age and the U.S. population becomes more diverse, demographic change is likely to accelerate in the coming years:
- Between 2007 and 2013, around 700,000 households were formed annually, far below the annual averages in the 1970s (1.7 million), 1980s (1.1 million), 1990s (1.35 million) and 2000s (1.1 million). “Much of this slowdown reflects the drop in household formation rates among younger adults in the wake of the housing bust and Great Recession.”
- “The share of adults in their 20s heading their own households remained 2.6 percentage points below rates 10 years earlier. This implies that there are 1.1 million fewer heads of households in this key age group.”
- Still, demographic forces alone will increase the number of new households by 11.6 to 13.2 million between 2015 and 2025. Immigration will drive much of the growth, “contributing about 26% of total increases in the 1990s and 35% in the 2000s.”
- Millennials are much more diverse than previous generations — 45% are minorities, compared to 41% of gen-Xers and 28% of boomers — and the impending losses of older, white households will magnify their impact: “By 2025, dissolutions of baby-boomer households aged 50-69 in 2015 will reach 3 million while those of the previous generation will reach 10 million. As a result, minorities will drive 76% of net household growth in the 10 years ahead.”
- As diversity rises, homeownership rates will fall, something “already apparent among younger age groups, which have experienced both the strongest growth in minority shares over the past two decades and the largest drop in homeownership.”
- Mobility has been declining since the 1990s and continues to fall: “The share of adults aged 18 and over that moved within the preceding year fell from 16% in 1996 to just over 11% in 2013, reducing the number of recent movers from 42.5 million to 35.9 million.”
Related research: Another 2014 report from the Joint Center for Housing Studies, “America’s Rental Housing: Evolving Markets and Needs,” examines the demographics of those who rent, the housing stock and its condition, construction trends and public-policy challenges now and in the future.
Keywords: household formation, minorities, housing stock, youth, youth, economic recovery, economy, consumer affairs


Expert Commentary