


Economist Thomas Piketty’s best-selling 2014 book Capital in the Twenty-First Century has stirred further debate about wealth and income disparities and their public policy dimensions. Other important events and trends have shaped the context of this renewed focus on issues of inequality in political discourse: From the 50-year anniversary of President Johnson’s Great Society to the impact of the Great Recession on poverty levels and middle class wealth, and subsequently the uneven gains of the fragile recovery.
An important part of this discussion has been about whether people of different incomes are paying their “fair share” in taxes. Movements such as Occupy Wall Street have put forth a critique of the current system of taxation. In the United Kingdom, a campaign for a “Robin Hood Tax” on financial transactions has focused on getting banks and other financial institutions to contribute more toward reducing the deficits in public finances that originated with the financial crisis. While such ideas have gained little traction in mainstream politics, there has been a renewed effort to crack down on global tax avoidance. A pivotal debate in the 2012 U.S. presidential election revolved around the figure of “47%” — the percentage of Americans who pay no income taxes. Meanwhile, the top 1% of households have shouldered as much as 26.7% of federal tax liabilities over the past decade.
A 2014 paper published in OECD Social, Employment, and Migration Working Papers, “Trends in Top Incomes and Their Taxation in OECD Countries,” analyzes data from the World Top Income Database to update previous work on income inequality and trends among the top 1% of incomes in OECD countries. The analysis incorporates data covering the global financial and economic crisis. The database, which was constructed by Piketty, among others, is based on information from tax returns in each country. This is a novel approach compared to the most commonly used measure of inequality, the Gini Coefficient, which is compiled using the results of survey data. The study’s authors, Michael Foster, Ana Llena-Nozal and Vahe Nafilyan, discuss reasons for the rise in incomes of the top 1% over the past 30 years; the impact of the Great Recession on their incomes; how those in the top income bracket respond to different forms of taxation; and the implications for tax policy.
The study’s findings include:
- The incomes of the top 1% have increased as a proportion of national income over the past three decades. In the 1980s, the share of total incomes that accrued to the top 1% was less than 10% in every OECD country, except Germany. By 2010, this had more than doubled in the United States and United Kingdom, and had risen strongly in other English-speaking countries.
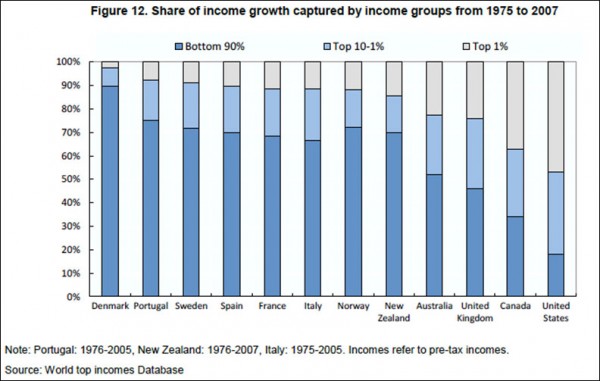
- Those in the bottom 99% have not matched this growth. As a consequence, the top 1% has captured a disproportionate share of overall income growth in the last 30 years — up to 47% in the United States. The figure was substantially lower in European countries, less than 10% where data is available. The following chart from the study provides country-level detail:
- Within the top 1%, there are considerable differences in income growth. In all OECD countries, those at the very top of the income distribution, the top 0.01%, have benefited most from the increasing concentration of income. This is the case even in those countries that saw less pronounced growth in the incomes of the top 1% overall.
- The top 0.01% also has the most volatile incomes, as they are more sensitive to business cycle fluctuations. This drove the decline in incomes for the top 1% during the Great Recession. Such a decline was temporary, however; recovery of top incomes had already begun in some countries in 2010, and was renewed at a faster rate than that for those further down the income distribution.
- Wages and salaries constitute the main part of income for the top earners, but decline as a proportion of income the closer to the very top of the income distribution you get. For the top 10% to 1% of earners, wages constitute 70% of income in Italy and more than 85% in Canada. For the top 0.01% the proportion is closer to 40%.
- There is a strong negative correlation between top marginal tax rates and the pre-tax shares of top incomes across OECD countries. The OECD average top personal income tax declined from 66% in 1981 to 42% in 2010. Similarly average corporation taxes have declined from 47% in 1981 to 25% in 2012; and taxes on dividend income fell from 75% to 42%, on average. Taxes on wealth and inheritance have also been reduced or abolished in several countries during this period.
“There is renewed interest,” the study’s authors conclude, “in adjusting the amount of tax that top income recipients are subjected to across several OECD countries because the sustained rise in the share of top income recipients in total income is taken as a sign that their ‘ability to pay’ tax may have increased and this has coincided with a period where public finances are tight. Trade-offs must, however, be taken into account when designing comprehensive tax reforms.” Further, they add: “In many OECD countries, the rise in overall inequality has also been driven by low-income households falling behind in relative and, sometimes, in real terms. In order to tackle the increase of overall inequality, a comprehensive policy strategy and policy mix of these policies to promote equality of opportunities is needed.”
Related researcj: See the OECD’s country statistical profile on the United States.
Keywords: economy, financial crisis, poverty
Expert Commentary