

Research has shown that over the last 30 years, income inequality has been climbing: Since the 1980s, the wealthiest 1% of U.S. households saw incomes rise 2.3 times, the top 0.1 percent more than 4 times, and the top 0.01% — the richest 15,000 families — more than 6 times. By comparison, between 1979 and 2005, average incomes for the poorest fifth of households rose by just 6% and incomes for the middle fifth rose 21%. Subsequent research has shown that the income gap is widening at an increasing rate.
The issue has received considerable attention, with President Obama calling inequality “the defining challenge of our time.” To help address the issue, advocates and some policymakers have proposed increasing the minimum wage to help poor Americans caught in low-paying jobs. The cost of inequality isn’t just to individuals: A study of 173 countries over 50 years suggested that income inequality can stunt economic growth.
The gap is not just in income, however, but also in the percentage of wealth that rich and poor hold: In the United States, the top 1% of earners netted about 20% of all income in 2009, but held more than 30% of the total wealth. Because wealth — be it real estate, stocks or other assets — produces income, higher ratios between wealth and income exacerbate income inequality.
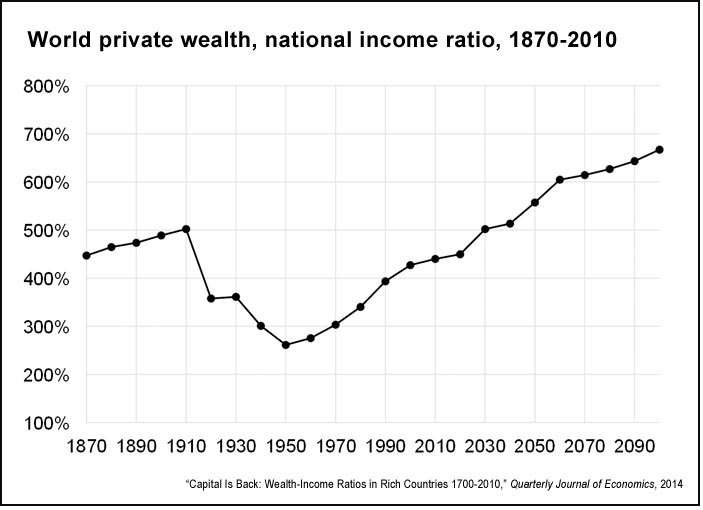
A 2014 paper in the Quarterly Journal of Economics, “Capital Is Back: Wealth-Income Ratios in Rich Countries 1700-2010,” seeks to better understand the dynamics of wealth inequality and its impacts. The study’s authors, Thomas Piketty and Gabriel Zucman of the Paris School of Economics, use newly available international data on the market value of all assets and liabilities held by each sector of the economy. The dataset covers the eight largest developed economies — the United States, Japan, Germany, France, the U.K., Italy, Canada and Australia — from 1970 to 2010, and stretches as far back as 1870 for Germany, 1770 for the U.S. and 1700 for Britain and France.
They find the following:
- Wealth-income ratios have been rising in each of the top eight developed countries over the last four decades, from 200% to 300% in 1970 to 400% to 600% in 2010. “In effect, today’s ratios appear to be returning to the high values observed in Europe in the 18th and 19th centuries (600% to 700%).”
- The evolution of wealth-income ratios has followed a U-shaped pattern: Prior to World War I, capital markets were largely unconstrained. During the interwar and postwar period, a number of policies were put into place that brought asset values down, reducing the wealth-income disparity. These policies were gradually lifted beginning in the 1980s, however, causing a sharp rise in wealth-income ratios.
- The U-shaped pattern is present in the United States, but is less pronounced than in other countries. This is a consequence in part of the country’s stronger population growth and lower saving rates.
- High wealth-income ratios can contribute to domestic asset price bubbles. For example, the wealth-income ratio in Japan reached 700% in the late 1980s, and 800% in Spain in 2008-2009; both bubbles collapsed with devastating effect not long after. This “suggests that monitoring wealth-income ratios may help designing appropriate financial and monetary policy.”
Overall, the findings suggest that the low wealth-income ratios of developed economies in the mid-20th century resulted from restrictive capital market policies, high productivity and substantial population growth. If income growth slows over the coming decades, wealth-income ratios are likely to rise significantly, potentially “reinforcing the need for progressive capital and inheritance taxation.”
Related research: A 2013 study, “The Economic Impacts of Tax Expenditures: Evidence from Spatial Variation across the U.S.,” looks at intergenerational income mobility — the chance of a child from the bottom fifth of income rising to the top fifth by the time he or she is an adult. The researchers — Raj Chetty and Nathaniel Hendren of Harvard University; and Emmanuel Saez and Patrick Kline of U.C. Berkeley — based their research on anonymous earnings records from millions of U.S. families with children born in 1980 or 1981 and who were citizens as of 2013. They found substantial variation within the United States: “Some areas have rates of upward mobility comparable to the most mobile countries in the world while others have lower rates of mobility than any developed country for which data are currently available.”
Keywords: poverty, inequality, wealth concentration, progressive taxation, inherentence tax, passive income, campaign issue
Expert Commentary