
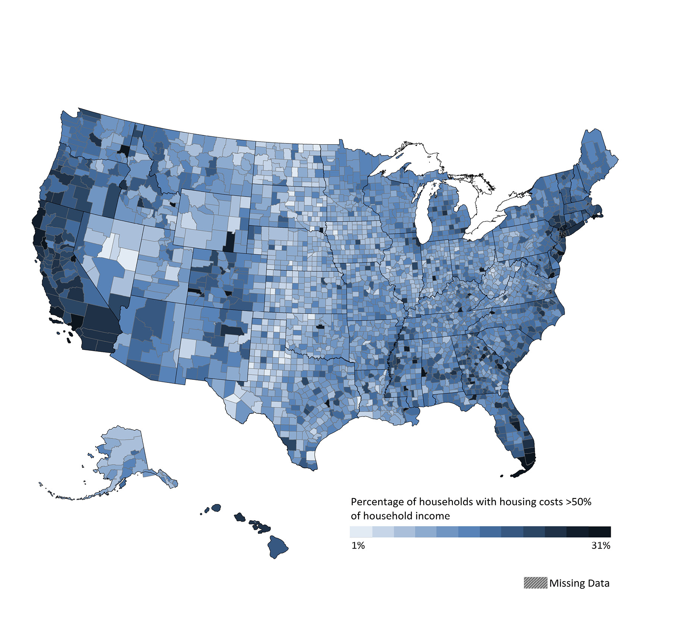


Over one in ten households in the U.S. spends more than half their income on housing costs – a financial burden that is associated with increased food insecurity, child poverty and a greater proportion of people in fair or poor health – according to new research conducted by the Robert Wood Johnson Foundation and the University of Wisconsin Population Health Institute.
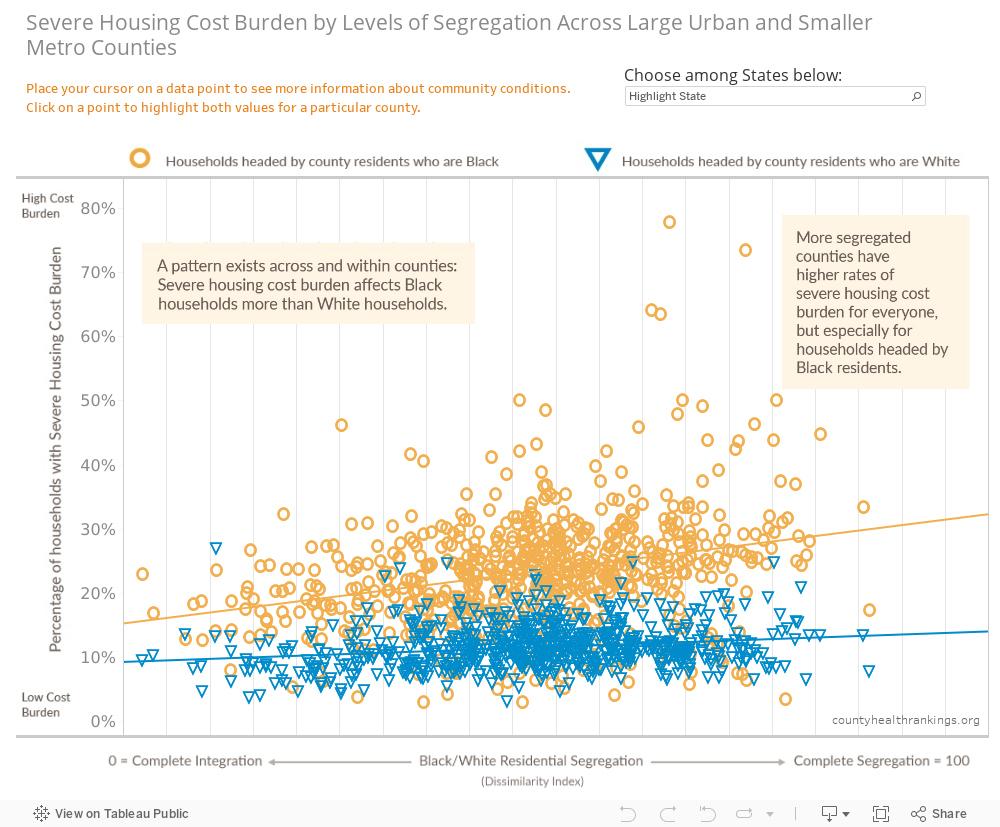
The annual collaboration, County Health Rankings & Roadmaps, analyzes the factors that influence health, such as structural factors, access to and quality of health care, and personal health behaviors, as well as health outcomes for almost every county in the nation. This year’s analysis, which examines both location and race, has a particular emphasis on housing. The research reveals that in the most segregated counties nearly one in four black households spends more than half their income on housing, compared with one in 10 white households.
Sheri Johnson, County Health Rankings Acting Director, said in a phone call with Journalist’s Resource that they focused on housing to help people understand that health is influenced by many variables, including the physical environment and social and economic factors.
“Where we live makes a difference in how well and how long we live,” she said.
Marjory Givens, County Health Rankings Deputy Director of Data & Science, added that the relationship between housing and health has numbers to back it up: “Looking to datasets that are collected nationwide, this issue of housing was one that certainly rose to the surface.”
The rankings, which reflect the relative health of counties within a state, are generated from the comprehensive analysis of more than 30 health-related measures within datasets collected through over a dozen regular, large-scale efforts, including reports from the Centers for Disease Control and Prevention, the National Center for Health Statistics, the Behavioral Risk Factor Surveillance System and the American Community Survey.
The findings highlight relationships between variables like housing cost burden (the percentage of households that spend over 30 percent of income on housing) and health status, diet and demographic information within counties.
Here are some of the key findings:
-
- On average, rates of “severe housing cost burden” – spending more than 50 percent of income on housing – are highest in large, urban, metropolitan counties. Rural counties have the lowest rates of severe housing cost burden.
- “Across counties, every 10 percent increase in the share of households that are severely cost burdened is linked to: 29,000 more children in poverty; 86,000 more people who are food insecure; 84,000 more people in fair or poor health,” the report of key findings states.
- Housing cost burden and severe housing cost burden are more common among renters than homeowners. Almost half of all renters are housing cost burdened. Severe housing cost burden affects one in four renters.
- Households headed by black people are more likely to rent – less than half own homes. On the other hand, the majority of households headed by white people are homeowners. And, over the past decade, homeownership rates haven’t changed much, though racial disparities have widened.
- Counties that are more segregated (a measure of the evenness — or unevenness — of distribution of black and white residents across a county’s census tracts) have higher rates of severe housing cost burden across the board. However, black households are affected to a greater degree: “In the most segregated counties (top 10 percent), on average, 26 percent of households headed by blacks and 12 percent of households headed by whites are severely housing cost burdened, while in the least segregated counties (bottom 10 percent), the rates are 18 percent and 9 percent, respectively,” the researchers write.
- Low-income families who are severely burdened by housing costs are considered at risk for homelessness. In large urban and smaller metropolitan counties, nearly 1 in 10 households (about 6.7 million in total) could be considered at risk for homelessness.
The rankings are accessible through an online tool that is searchable by state and county. The tool compares health outcomes and health factors across a state’s counties.
Counties are ranked within states, but not across the country. “The rankings are intended as a call to action at the state level for local communities to be thinking about how they can mobilize and take action,” Givens said. “We believe change making really happens at the local level.”
A useful tool for journalists
Givens suggested that the rankings are a useful tool for journalists, too. “Our annual reporting offers a wonderful place for journalists to explore,” she said, adding that journalists can use the rankings to learn more about the health of their communities.
Johnson said that the rankings offer an opportunity for journalists to highlight structural factors, such as social and economic factors, that affect who has the opportunity to own a home, and who might have experienced discrimination or obstacles to home ownership.
Givens also noted that journalists can act “as really important change makers themselves in this journey.” Their coverage of housing and health can play a “critical role in helping to motivate and call attention to what’s needed, and also to celebrate what’s going well,” she said.
Further, the program’s searchable “What Works for Health” tool can help journalists discover solutions that have worked to reduce disparities and learn about communities that have served as exemplars for expanding access to affordable housing.
For related resources, check out our tip sheet on finding housing affordability data, our write-up of research on the community effects of treating a neighborhood as a patient, and our roundups on abandoned buildings and gentrification.
Expert Commentary