

The problem of homelessness is a particularly difficult one for researchers to understand and journalists to cover. As a 2013 study in the American Journal of Public Health indicates, even those who have deep knowledge in this area and work directly with the homeless often have difficulty assessing patterns and needs.
In addition, the problem’s deep and sometimes hidden causes, the diversity of stories of those affected, and the often-invisible nature of life on the streets complicate attempts to quantify the true size and nature of the homeless population. For a sense of the state of current scholarship, see “The New Homelessness Revisited,” published in the Annual Review of Sociology. That paper identifies the broad areas of agreement among scholars and outstanding research questions.
To better assess the state of the problem in the United States, in 2007 the federal government began providing a yearly snapshot of the homeless population in states across the country. While the national census highlights general trends, researchers point out that the very nature of question — “How many people are homeless?” — is both misleading and nearly impossible to answer in any precise way, as witnessed by the varying estimates and methodologies. In 2010 the federal government found that 1.6 million people experienced homelessness at some point and were sheltered. A major 1999 report produced by the federal government, the Urban Institute and leading researchers estimated that there were 2.3 million people who experienced homelessness over a given year. While that figure is still cited, the National Coalition for the Homeless tried to compensate for under-counting and put the figure at approximately 3.5 million.
The U.S. Department of Housing and Urban Development’s 2013 “Annual Homeless Assessment Report” furnishes data on both the sheltered and unsheltered population according to the results of a survey done on a single night in January — this is called “point in time” counting, and is generally acknowledged to be the most accurate way to establish valid trend data. (Again, it is not a projection on an annual basis.) For the first time, communities reported the ages of those affected. The report defines “chronic homelessness” as cases where a disability of some kind is involved and the individual or family has “either been continuously homeless for one year or more or has experienced at least four episodes of homelessness in the last three years.”
Key report findings include:
- There were 610,042 homeless persons counted; 65%, or 394,698 persons, were living in shelters or transitional housing of some sort, while the rest, 215,344, were living in places such as abandoned buildings or cars, or under bridges.
- This overall figure represents a 4% percent decline over 2012 numbers and 9% since 2007. The following chart from the report presents trends from the government “point-in-time” surveys:
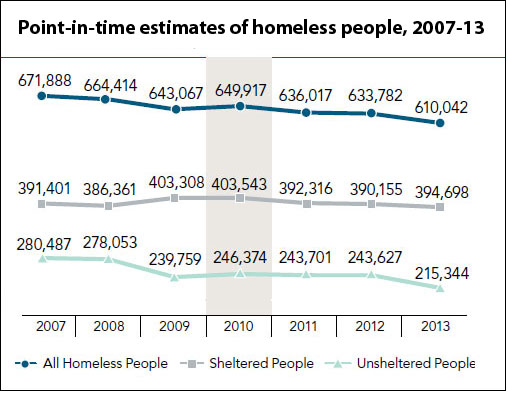
- The total 2013 chronic homeless population in 109,132, represents significant progress: That figure is down 7% from 2012 and 25% over 2007 figures.
- There were 57,849 homeless veterans recorded in 2013, and 40% were unsheltered. But that population has also declined in recent years.
- Among persons in homeless families, 58% were children (130,515).
- The new age-related data obtained by the 2013 report reveals striking problems among youth: “There were 46,924 unaccompanied homeless children and youth on a single night in 2013. Most (87% or 40,727) were youth between the ages of 18 and 24, and 13% (or 6,197) were children under the age of 18. Half of unaccompanied children and youth (23,461 or 50%) were unsheltered in 2013.” (This population is very difficult to count with any accuracy; see this Urban Institute brief on the issue.)
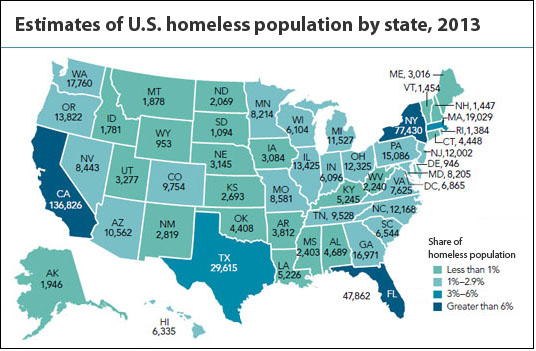
- The national trends can hide significant regional variation: “20 states experienced increases in homelessness between 2012 and 2013. New York experienced the largest increase (7,864 people), followed by California (5,928 people). Other states with large increases include South Carolina (1,629), Massachusetts (1,528), and Maine (623).”
Statistical reports are also available for individual states detailing their homeless populations and the types of persons affected.
Related research: A 2013 study, “The Age Structure of Contemporary Homelessness: Evidence and Implications for Public Policy,” uses a longitudinal sample from New York City to assess broad trends in the demographics of this population. Another study, published in the American Journal of Public Health, “Characteristics of Emergency Department Visits by Older Versus Younger Homeless Adults in the United States,” looks at the differences between age cohorts in terms of medical needs (also see a 2013 study on the nature of injuries presented). Finally, although health care reform opens new opportunities for homeless persons, there remain significant logistical hurdles to extending Medicaid to this population.
Keywords: youth, children, transient population, soup kitchen, street people, shelters, underhoused
Expert Commentary