Not even a decade ago, bikeshare was an afterthought in most cities’ transportation plans — if it was thought of at all. Early systems in the United States and Europe often had to use the honor system, and the results were predictably depressing. All that changed with the 2005 launch of Velo’v in Lyon, France. While it didn’t pioneer the use of purpose-built bikes, dedicated docking stations, smart cards, and a fee structure that encourages short-term rentals, it was one of the first to bring all these elements together, and at scale. The result was an embrace by residents, a significant presence in city life — and plenty of imitators.
Fast-forward 10 years, and there are more than 850 public bikeshare systems around the world, from Lansing, Mich., to New York City; from Melbourne, Australia, to Helsinki, Finland. While new-generation bikeshare systems aren’t immune to technical and economic difficulties — the world’s largest, in Wuhan, China, is being retooled after its rapid expansion overloaded the private operator — they appear to be a permanent part of how cities will work going forward. They’re a prominent component of the sharing economy, and have transformed how citizens and public officials think about personal mobility and urban design.
Prior research has demonstrated a wide range of benefits from bikeshare systems as well as from adapting city streets to make cycling safer and more attractive. Infrastructure upgrades were found to be particularly effective, with cycle tracks drawing more than twice as many riders as nearby roads without them. Improved human health from increased physical activity far outweighs any additional mortality from crashes and exposure to car exhaust — the equivalent of more than 75 deaths avoided for every 1 lost, according to a 2011 study based on the Barcelona bikeshare system. Even those not on bikes benefit from increased cycling, as CO2 emissions fall with every car taken off the road.
A 2015 research survey and analysis published in Transport Reviews, “Bikeshare: A Review of Recent Literature,” provides an overview of the state of research on bikeshare programs (BSPs). The author, Elliot Fishman of Utrecht University, reviewed English-language bikeshare literature from North America, Asia, Europe and Australia. The review provides insight into the demographics of bikeshare users, the reasons behind system growth as well as factors holding back system adoption, the impact it has on reducing car use, and the relationship between bikeshare and road safety.
Overall findings on bikeshare growth and system size:
- Bike sharing systems have increased rapidly since the mid-2000s, growing from 13 in 2004 to 855 a decade later. Of these, 54 are in the United States. The countries with the largest number of systems are China (237), Italy (114) and Spain (113).
- The number of bicycles observed often differs from those reported by operators. The systems with the highest number of observed bicycles were Paris (17,902), London (9,901), Changshu (5,924), New York (5,233), Barcelona (5,115), Zhongshan (5,110), Brussels (3,742), and Montreal (3,594). Other leading U.S. systems include Washington, D.C. (2,596), Minneapolis (1,446), and Boston (1,077).
- Current systems, referred to as “third generation,” are characterized by automated credit card payments, technologies such as GPS that enable the tracking of bicycles, and mobile applications that show the availability of bikes and available docks in real time. Looking forward, fourth-generation bikeshare could include dockless systems and improved transit integration.
Usage:
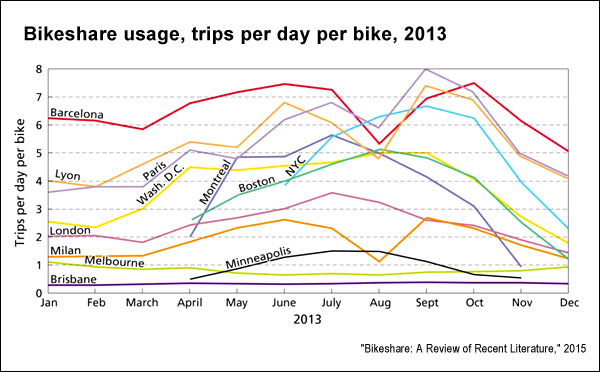
- The standard metric for comparing the usage of different bikeshare systems is the number of trips per day per bicycle. “Barcelona is the most heavily used across the year, with New York City’s Citi Bike achieving a remarkable four trips per day per bike in its first full month (May 2013), and almost doubling by September. Paris has the highest peak, reaching eight trips per day per bike in September. Washington, D.C., consistently reached four to five trips per day per bike in summer and even in their sometimes icy winters have at least twice the usage of Australian BSPs during their busiest months (January/February).”
- Usage between systems can vary significantly, but generally peaks between 7 and 9 a.m. and 4 to 6 p.m. weekdays; on weekends, usage is often strongest in the middle of the day. The average ride duration is between 16 and 22 minutes, with casual users typically taking longer trips than annual members.
What users are looking for:
- Convenience is a significant factor in bikeshare use. In 2013, Washington, D.C.’s Capital Bikeshare surveyed its some 11,100 members; 69% of those responding said that getting around fast and easily was a “very important” part in their motivation.
- Lower-income users cited the importance of saving money compared with other transportation options. In a study of London’s system, members who resided in poorer areas had higher trip rates than those living in more affluent suburbs.
- The distance between users’ homes and the nearest docking station is an important predictor for bikeshare membership. For example, Montreal residents living within 500 meters of a docking station were 3.2 times more likely to have used Bixi, the city’s bikeshare system. Consequently, system density is a key factor in overall usage.
- Trip purpose varies depending on the type of user and other factors. For Capital Bikeshare, the last trip for 43% of long-term members was work-related; for short-term users, work trips averaged just 2%. In London, 52% of rides of long-term users were work related, with no other purpose reaching 10%. In Brisbane, 65% of trips were for “leisure or sightseeing.”
User demographics:
- Compared to the general population, bikeshare members tend to earn more and be better educated, work full-time or part-time, and are more likely to be male than female. The specifics vary by system, however: For example, a Capital Bikeshare survey found that in comparison to regular bicycle riders, “users were more likely to be female, younger and own fewer cars and bicycles.” Users were likely to have lower average incomes than regular cyclists, but higher than the city’s general population. In London, early adopters were disproportionately wealthy, but from 2010 to 2013, the proportion of users from low-income areas doubled, from 6% to 12%.
- “In countries with low levels of general cycling, such as the U.K., the USA and Australia, between 65% and 90% of cycling trips are by men, while in strong cycling countries such as the Netherlands, women cycle more than men. Unsurprisingly therefore, BSPs in countries with low cycling usage have lower levels of female participation. For instance, less than 20% of trips by registered users of the London BSP are by women, though this proportion rises slightly when looking at casual users.”
- Bikeshare users’ ethnicity often differs from that of the general population: In London, 88% of users identify as white, compared to 55% of residents. In Washington, D.C., only 3% of users are African-American (the U.S. Census notes that African-Americans make up 49.5% of the city’s population.)
Health impacts:
- Depending on the mode substitution — which form of transport biking may displace — “bikeshare was found to have a positive impact of physical activity, leading to an additional 74 million minutes of physical activity in London, [and] 1.4 million minutes of physical activity in Minneapolis/St. Paul, for 2012.” If the user had walked previously, there might be a decrease, but substitution from transit and car use led to increased activity.
- Bikeshare users appear less likely to be injured in crashes than private bike riders. A study of hospital data from five U.S. cities with BSPs, as well as five cities without BSPs during a two-year period before BSP implementation and a year after, found that there was a “dramatic reduction” in the total number of recorded injuries after bikeshare systems were introduced. “This is consistent with the so-called ‘safety in numbers’ phenomenon, in which a rise in the amount of cycling does not lead to a proportional rise in the number of injuries.”
- Despite having the lower injury rates, bikeshare users are less likely than private cyclists to wear helmets: In New York City, approximately 85% of Citi Bike users do not wear a helmet, and the rate is 45% for Capital Bikeshare. Helmet usage rates vary by the type of membership: A 2013 study found that 63% of long-term subscribers did not wear helmets, rising to 94% for short-term users. “An explanation for this difference might be that short-term subscribers may be more likely to take spontaneous trips, in which they did not have a helmet with them.”
- Rather than increasing compliance, mandatory helmet laws tend to decrease bike usage. This may be one of the reasons for the low rates in Australia, which has a national helmet law — the systems in Melbourne and Brisbane average around 0.8 and 0.3 trips per day per bike, far below the performance of bikeshare in other countries. As a preemptive move to boost usage levels, Tel Aviv and Mexico City repealed their mandatory helmet laws.
System impacts:
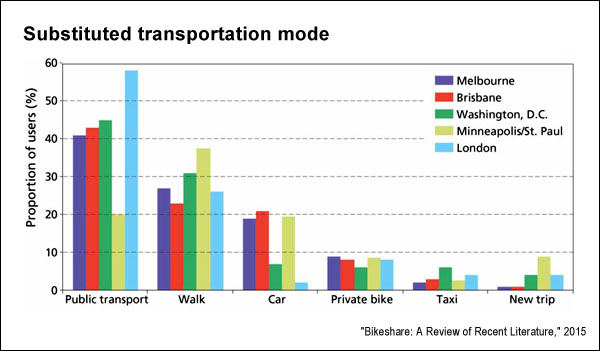
- Bikeshare primarily replaces trips that would have been taken by, in order, public transportation, walking and driving. An multi-city analysis showed that in all but one city, bikeshare systems reduced vehicle kilometers travelled. The exception was London, which had low substitution rates from cars and a large coverage area, requiring substantial rebalancing efforts.

- “Rebalancing” continues to be a challenge for operators — moving bikes from full racks to those without bicycles, so that users always have a bike to take, or can always find an empty dock. Research has focused on the role of topography (users tend to like to roll downhill rather than pedal up, for example) and weather, and the potential of incentives to encourage users to rebalance the system themselves. “The results suggest that while price incentives may be sufficient on weekends, usage patterns on weekdays are such that a combination of operator and user redistribution is required to maintain an adequate level of service.”
“Few predicted bikeshare’s rapid rise,” the researcher notes in his conclusion, but the volume of research has been substantial and reveals three key themes: First, the demographics of bikeshare users differ from those of the general population. Second, convenience is the major factor motivating users, linked to the concept of “perceived usefulness” found in related research. Third, because bikeshare is more likely to replace transit or a walking trip than use of a car, additional efforts are required to encourage its use and thus maximize the societal and environmental benefits it provides.
Related research: A 2014 study in Environmental Health Perspectives, “The Societal Costs and Benefits of Commuter Bicycling: Simulating the Effects of Specific Policies Using System Dynamics Modeling,” looks at four options for increasing cycling in the city of Auckland, New Zealand (comparable in size to San Antonio, Texas, or San Diego, California). The study found that the option that was the most ambitious in terms of infrastructure had the greatest return on investment, saving $24 for every $1 spent, and provided the most societal benefits: By 2051, car use would drop to 40% of all trips, cycling would rise to 40% and the death and injury rates for cyclists would fall to 20% of those in the business-as-usual scenario. Also of interest is a 2014 article, “Covering Bicycling and Bike Infrastructure: New Data and Angles,” which pulls together 10 issues and related academic studies that can help facilitate deeper coverage of cycling. Topics covered include cycling trends, automotive pollution and cycling, infrastructure, immigrants and cycling, and bike commuting.
Keywords: bicycles, cycling, bike share, fleet rebalancing, automobiles, car use, climate change, congestion, public health


Expert Commentary