


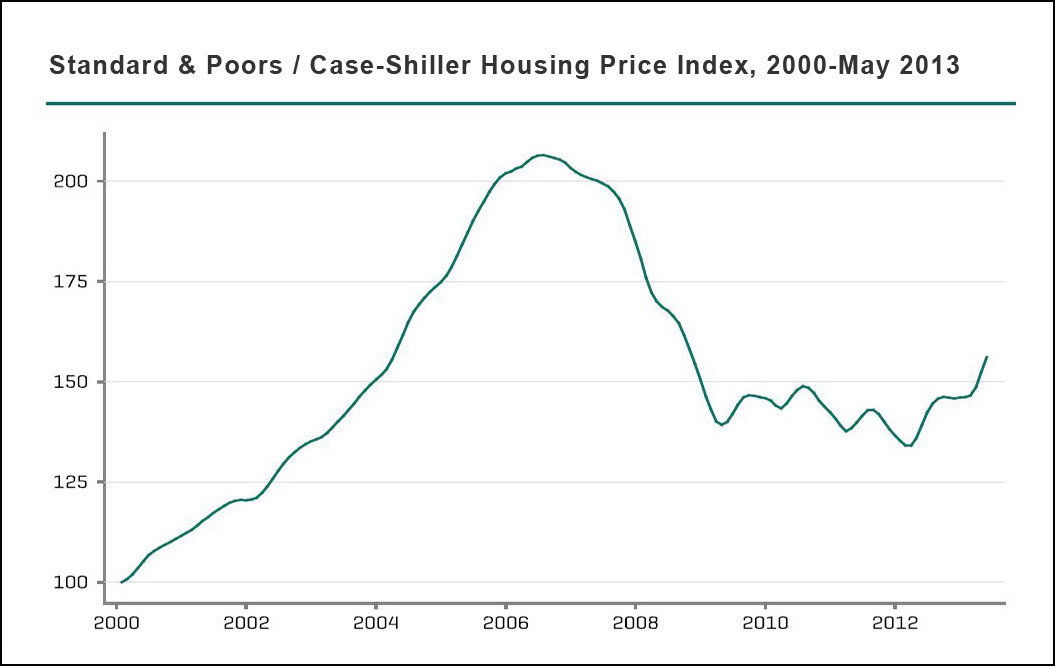
The U.S. housing news is in, and the news is good: The S&P/Case-Shiller price index rose significantly in May 2013, up 12.2% over a year earlier. The index is based on sales in 20 bellwether U.S. metropolitan areas, including New York, Boston, Chicago and Los Angeles. All 20 cities posted gains over the previous year, including Detroit and Las Vegas, both of which suffered significantly during the 2006 housing bust and ensuing economic crisis.
Digging deeper, however, there are a number of less obvious reasons for the dazzling jump: One significant contributor was the falling number of distressed properties sold — foreclosure rates are at a six-year low; previously, the discounted prices of houses sold by banks had been pushing the average down. The supply of houses on the market remains limited as well, encouraging bidding wars. It’s also important to remember that despite attention-getting numbers in Dallas and Denver — both cities topped records back to the year 2000 — overall the S&P/Case-Shiller index would need to gain an additional 50% to reach its 2006 peak.
Given the severity of the housing collapse, however, all signs of a rebound are welcome. The 2012 report from the Joint Center for Housing Studies at Harvard University showed that a recovery was slowly getting underway; the 2013 edition indicated that it was solidifying. The latter showed that sale prices in March of that year were up nearly 12% over 2012. Construction starts of single-family homes in 2012 were up a whopping 24% over the previous year, even if they remained just half the average in the 1980s and 1990s. As reported by the Center’s annual Leading Indicator of Remodeling Activity (LIRA) report, remodeling of existing properties is also up as homeowners feel increasing confidence about the market — in 2013, they’re anticipated to peak at nearly $151 billion, up 19.8% year over year.
A useful source of information and context on the state of the U.S. housing market are the Census Bureau’s annual Characteristics of New Housing reports. The most recent edition, “2012 Characteristics of New Housing,” provides a wide range of detailed information on new homes and multifamily buildings in the United States. In some cases data is provided as far back as 1973; for more recent years it includes everything from the type of foundation to the kind of siding, as well as average and median size, sales price and square footage.
The findings include:
- There were 483,000 single-family homes built in 2012. The average sales price was $292,200, up 9.07% from the 2011 average of $267,900. The 2012 average is still down 15.8% from the inflation-adjusted average for 2006, $347,028.
- In 2012 the average price per square foot for new single-family homes was $86.30, an increase of 3.5% from the previous year’s average of $83.38. The 2012 average remains 17.3% below the peak of 2006, which was the inflation-adjusted equivalent of $104.36.
- The Northeast had the highest average regional price, $122.60 per square foot, while the lowest was the south, at $78.44. In between were the West at $96.24 and the Midwest at $90.25.
- The number of square feet in a single-family house is essentially flat: The average single-family house completed in 2012 had 2,505 square feet, up just 1% from 2011’s average of 2,480 and 1.5% from 2006’s 2,469 square feet.
- Average lot sizes continue to shrink: In 2012 the average single-family home sold was on a lot of 15,634 square feet. This is down 6.2% from 2011’s average of 16,663 square feet and 7.8% below 2006’s average of 16,959.
- Contractor-built single-family housing is up, but remains well below its pre-crash peak: In 2012 82,000 units were built, an increase of 10.8% over 2011’s total of 74,000. While contractor-built houses are up in 2012, they’re still just 40% of the high-water mark in 2003, when 205,000 units were built.
- Multifamily unit construction was up sharply: 245,000 were constructed in 2012, up 37.6% over 2011’s total of 178,000. The 2012 number is also up 124.8% from the depths of the crash in 2009, when only 109,000 multifamily buildings were constructed.
- Age-restricted multifamily units dropped slightly in 2012, with just 17,000 built; the number in 2011 was 18,000.
A related 2012 report from the Conference Board’s Demand Institute, “The Shifting Nature of U.S. Housing,” looks at the dynamics of the post-recovery U.S. housing market. It sheds light on how multifamily buildings, often rentals, have become an increasingly large part of the housing picture. Also of interest is a 2012 study from the Federal Reserve Bank of New York and the University of Pennsylvania, “Housing Busts and Household Mobility,” which studies the role of three “financial frictions” on household mobility: rising mortgage rates, high property taxes, and “underwater” mortgages. Finally, “Why Has Regional Income Convergence in the U.S. Stopped? Zoning and Inequality,” a 2012 study from Harvard University, looks at the relationship between housing prices and rates of income convergence, a measure of inequality.
Keywords: consumer affairs, real-estate taxes, mortgage-interest deduction, sprawl
Expert Commentary