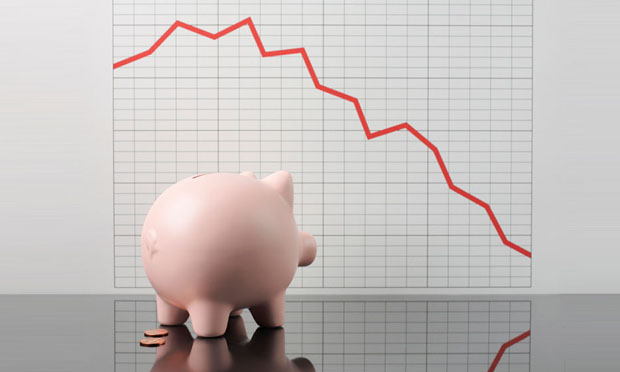
Research on rising economic inequality in the United States, and the corresponding “hollowing out” of the middle class, is substantial. Beyond the straight numbers, though, researchers are also studying different aspects of these issues, such as how race can exacerbate the chances of downward mobility. Many U.S. households are extraordinarily fragile economically, just one emergency away from severe trouble. When asked about income distribution in the United States, the public continues to underestimate the depth of inequality and expresses preferences for a much more equal distribution of wealth, research has shown.
In any case, median household income is down 8.1% from its 2007 levels, before the recession, and stood at $50,054 in 2011, a 1.5 percent decline from 2010, according to a 2012 U.S. Census Bureau report.
Such national economic trends are reflected in the family budget, but they also produce psychological effects and have created an atmosphere of gloominess among many Americans when asked about the future. A 2012 report from the Pew Research Center, “The Lost Decade of the Middle Class,” surveyed nearly 1,300 Americans who identify as “middle class”; it also analyzed census and Federal Reserve data to put changing attitudes in context.
The report’s findings include:
- Eighty-five percent of respondents said it is “more difficult” for “middle class people to maintain their standard of living” compared with a decade ago. When asked if it was likewise “harder to get ahead today” than 10 years ago, 71% of middle class respondents agreed.
- The greatest blame was placed on Congress (62%), with banks and financial institutions (54%) and large corporations (47%), second and third, respectively. Other answers included the Bush administration (44%), foreign competition (39%), the Obama administration (34%) and the middle class itself (8%).
- Defining “middle class” as adults whose annual household income is two-thirds to double the national median, an analysis finds that 51% of all adults were middle class in 2011, compared to 61% in 1971. The upper-class comprised 20% of the population in 2011, compared to 14% in 1971.
- In 1971, the middle class had 62% of the income pie; in 2011, that figure fell to 45%.
- “For the middle-income group, the ‘lost decade’ of the 2000s has been even worse for wealth loss than for income loss. The median income of the middle-income tier fell 5%, but median wealth (assets minus debt) declined by 28%, to $93,150 from $129,582. During this period, the median wealth of the upper-income tier was essentially unchanged — it rose by 1%, to $574,788 from $569,905. Meantime, the wealth of the lower-income tier plunged by 45%, albeit from a much smaller base, to $10,151 from $18,421.”
- There has been an “increase in those who self-identify as being in the lower or lower-middle class — 32% place themselves in these categories, up from 25% in 2008. And 17% now say they are in the upper or upper-middle class, down from 21% in 2008…. Similar shares of whites (51%), blacks (48%) and Hispanics (47%) say they are middle class, even though government data show that whites have a higher median income and much more wealth than blacks or Hispanics.”
- “About a quarter (23%) say they are very confident that they will have enough income and assets to last throughout their retirement years; an additional 43% say they are somewhat confident and 32% say they are not too or not at all confident.”
- “Some 43% of those in the middle class expect that their children’s standard of living will be better than their own, while 26% think it will be worse and 21% think it will be about the same. “
The report notes that there have been distinct winners and losers in the American economy: “Over the longer term — 1971 to 2011 — older adults fared better than younger ones, married adults fared better than the unmarried, and college-educated adults fared better than those with less education.”
Tags: inequality, survey


Expert Commentary