


The issue: It’s well established that people around the world are living longer thanks to modern health care and medicine. In India, for example, life expectancy at birth has increased from 41.2 years in 1960 to 68 years in 2014, according to World Bank statistics. The average American’s life expectancy was 69.8 years in 1960. It was 78.9 in 2014, the most recent year for which data are available. Women worldwide generally live about five years longer than men.
Less known is how much this costs governments. As a population ages, the ratio of working-age people to retirees decreases. That has economic implications, affecting public expenditures on pensions and healthcare. Workers pay into a tax pool that helps cover these expenses for the retired. It is doubly hard to make those payments if, as a population ages, fertility falls — meaning even fewer workers. To meet the challenge, countries are raising their retirement ages, from 65 to 67 and even to 70, according to the Organization for Economic Cooperation and Development (OECD).
Countries have different age structures, so they respond to longer life expectancies differently. In the United States, labor-force participation — the number of adults who are not in prison or the military and are working or actively looking for work — is around 62.8 percent, according to the federal Bureau of Labor Statistics. When the population ages, as it is in the U.S. with the baby-boomer generation retiring, the participation rate falls.
How much that rate needs to change to keep an economy on track is the subject of a new paper.
An academic study worth reading: “A Cost of Living Longer: Projections of the Effects of Prospective Mortality Improvements on Economic Support Ratios for 14 Advanced Economies,” published in Population Studies, 2016.
Study summary: Nick Parr and colleagues at Macquarie University in Sydney, Australia, seek to quantify the economic impact of aging populations in 14 developed countries. They show how increased longevity (what researchers sometimes call “decreased mortality”) changes the “support ratio” — that is, the number of people between age 16 and 64 per person aged 65 or older.
Parr and colleagues make a distinction between an aging population (where the mean age is moving upward) and longevity: People are living longer, but a driver of the increasing costs of caring for the elderly is the support ratio. Raising the retirement age is one solution.
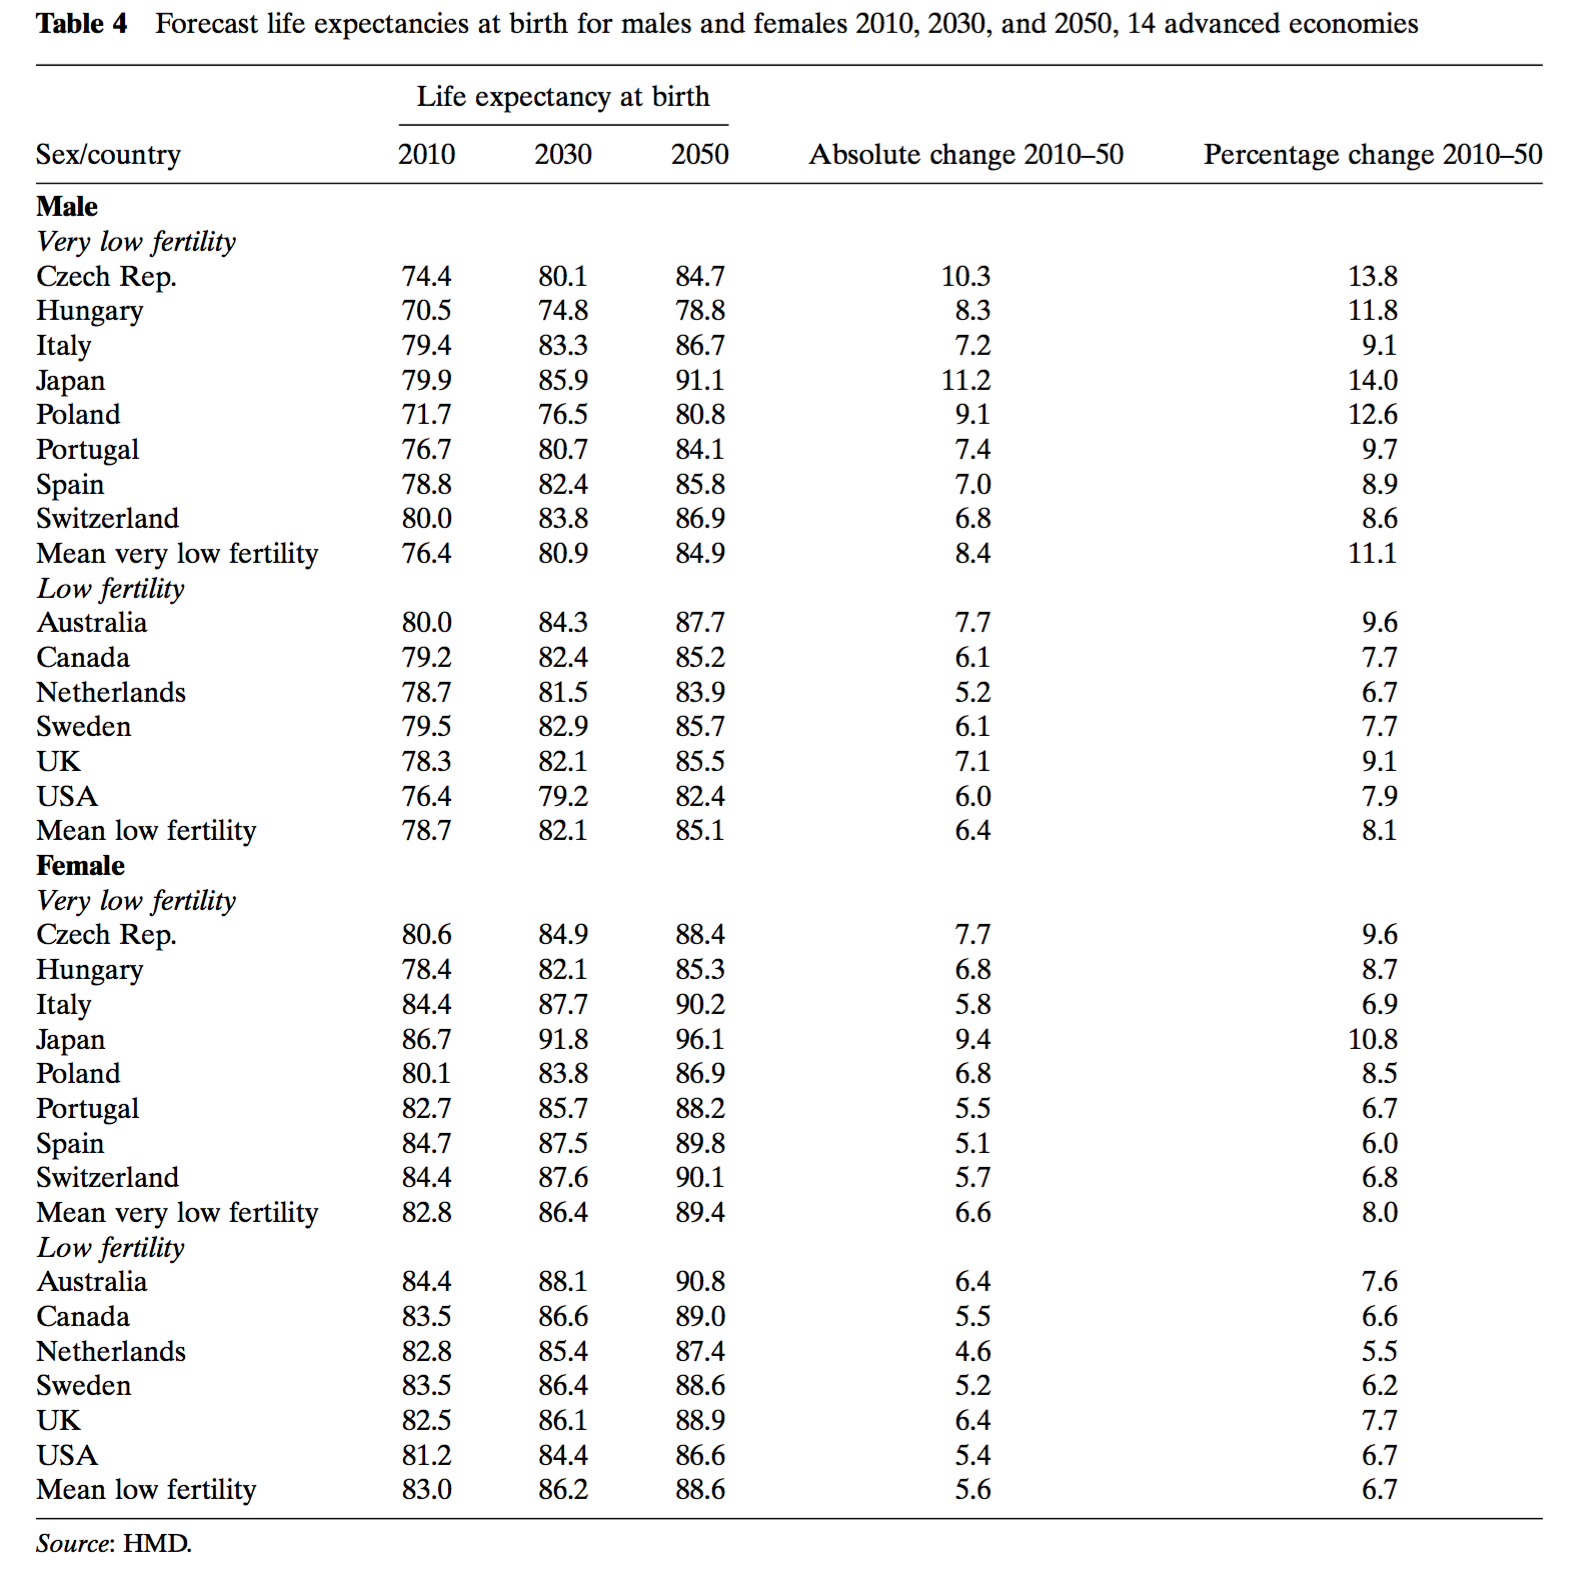
They chose 14 developed countries based on available data and size, favoring large countries over small ones so as to have larger sample sizes. They grouped them into two categories based on fertility rates, with one group having “low” fertility rates and the other having “very low” rates. Those considered “very low” were the Czech Republic, Hungary, Italy, Japan, Poland, Portugal, Spain and Switzerland. Those with “low” fertility: Australia, Canada, the Netherlands, Sweden, United Kingdom and the U.S.
Parr and colleagues extrapolated mortality information ahead 40 years using the Poisson Common Factor, a model that includes local patterns in each country. They used death statistics from the Human Mortality Database and other demographic data from the OECD and Eurostat, the European statistics agency. With these models, the authors are able to project several things, including how much the participation rate — the percent of adults working or actively looking for work — must change across the board and how much it must change only among those over age 60 in order to fund social programs.
Findings:
- The biggest projected increase in life expectancy is in Japan. All countries considered in the paper are expected to grow older in the 2010-2050 period. (See this graph.)
- Gains in longevity are negatively associated with fertility. People are having fewer children as they live longer.
- Countries with lower fertility rates age faster. Out migration (from Poland and Japan, for example) are also factors in their aging populations.
- Net immigration and higher fertility indicate a country will see a slower aging of the population.
- For all countries surveyed, the support ratio is projected to be significantly lower in 2050 than in 2010. This is caused by the growing number of older people and falling birthrates, but is a greater issue in countries with very-low birthrates. These support ratios fall the most in Poland, Spain and Italy; they fall least in northern Europe, Australia and the United States.
- These changes will happen faster between 2030 and 2050 than between 2010 and 2030.
- These increases in longevity will negatively impact living standards in all countries measured, according to a scale developed by the authors. The countries to feel the negative effect most strongly are those with the lowest fertility rates, like the Czech Republic and Japan. This impact will be weakest in the U.S., the Netherlands, Canada and Sweden.
- The authors measure the increases in labor-force productivity among the general population that would be required to offset the negative impact of projected longevity increases (see chart below): 7 percent in the Czech Republic, 8.1 percent in Japan and 2.8 percent in the U.S.
- Among those over age 60, the following increases in labor-force participation would be required to undo the negative impact: over 100 percent in Czech Republic, Hungary and Poland, and by about 30 percent in the United States and Japan. In other words, in the Czech Republic the number of working people over age 60 would have to double.
- Countries with low fertility benefit from immigration, which helps flatten age curves. Despite a rapidly increasing life expectancy, Australia is relatively protected by high immigration.
- When fewer women than men work, it is harder for a country with low fertility to respond to the challenges of the support ratio.

Helpful resources:
- The World Bank’s statistics website allows users to visualize demographic indicators like life expectancy on maps and line charts.
- A 2016 analysis from the nonpartisan Congressional Budget Office discusses the health of America’s federal pension system, Social Security.
- The Social Security Administration, which manages the pension system, offers a life-expectancy calculator to help Americans plan for retirement.
- The Bureau of Labor Statistics publishes a number of alternatives to labor-force participation data.
Other research:
- A 2015 paper in Psychology, Health and Medicine examines the reasons women worldwide tend to live longer than men.
- A 2006 study from the National Bureau for Economic Research looks at how increasing longevity impacts economic growth.
- A rise in life expectancy slows per-capita GDP growth, according to a 2015 study in The Economic Journal.
- For more on expected changes to labor-force participation, see this 2014 paper by the Federal Reserve Bank of Boston.
Keywords: baby boomers, death, sickness, aging, health care, mortality, Golden Years, retirement, elder care
Expert Commentary