Property taxes are not always one of journalists’ favorite topics, in part because the issue is complex and usually involves analyzing budgets and crunching numbers. But the subject is of widespread interest — especially if local officials are considering raising or lowering property taxes. Nearly everyone is affected, whether it’s the homeowners and business owners who pay the tax, the government officials who decide how the money will be used, or the residents who benefit from the government services the tax proceeds fund.
Also referred to as millage taxes and ad valorem taxes, property taxes are levied on land, buildings and improvements made to property. States vary in what types of property they tax and how taxes are levied. Some also tax personal property used for business purposes, including machinery, tools and furniture. Typically, tax rates are expressed as the number of dollars owed per $1,000 of assessed value. Some local governments use “mill units” to express tax rates. A mill is equal to 1/10th of 1 cent and is charged on every $1 of assessed valuation. A 5% tax rate, for example, can be expressed as $50 per $1,000 of property value or 50 mills.
The U.S. Census Bureau reports that state and local governments collected an estimated $119.4 billion in property-tax revenue during the first quarter of 2015. For many local governments, property taxes are a critical source of funding, yet community leaders are under constant pressure from the public and the business community to reduce taxes or limit increases even as property values fluctuate and the economy shifts — and the need to pay for law enforcement, public education and other services continues unabated.
In an effort to reduce property-tax burdens, more than 40 states have enacted tax and expenditure limits. However, research has shown that there are a range of unintended effects, including underinvestment in infrastructure. Poorer communities often find themselves in competition with better-off neighbors, and often must resort to raising fees or finding other sources of income. Tax-incremental financing is an increasingly popular tactic to fund infrastructure improvements, but research has shown that it brings with it substantial risk and can create conflicts of interest.
As reporters explore issues related to property taxes, a 2015 study from the Lincoln Institute of Land Policy and the Minnesota Center for Fiscal Excellence offers valuable insights. For the past several years, these two organizations have co-produced an annual report titled “50-State Property Tax Comparison Study.” The 2015 edition, based on 2014 data, compares “effective property-tax rates” (ETR) — or the total tax divided by total value — for four classes of property located in each state’s largest city and in the District of Columbia, as well as in the nation’s 50 largest cities and a rural area of each state.
The authors note that effective property-tax rates “reflect more accurately the relationship between property taxes and the market value of individual properties by taking into account the effects of statutory tax provisions and local assessment practices.”
Among the report’s key findings:
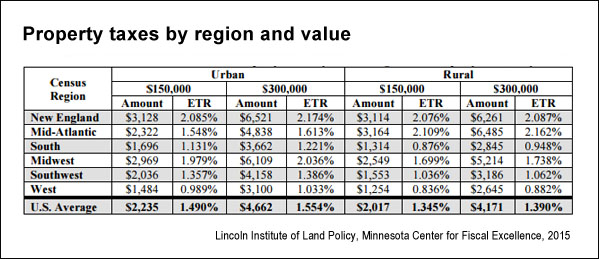
- In urban and rural areas, the average effective property tax rate in the United States is fairly consistent for homes valued at $150,000 and $300,000: It varies from 1.345% on less expensive homes in rural areas to 1.554% on more expensive homes in urban areas. But there is significant variation among regions of the country — the highest urban rates were found in New England and the Midwest while the West and South tended to have lower rates. In rural areas, the highest rates were in New England, the Mid-Atlantic and the Midwest.
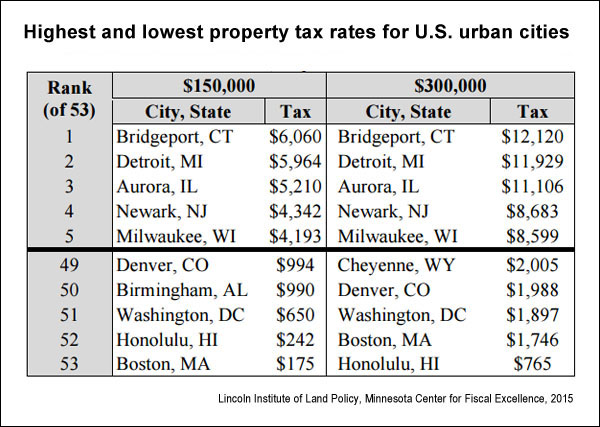
- Property taxes vary substantially across the United States. The chart below shows how certain urban cities ranked in terms of property taxes charged on homes valued at $150,000 and $300,000. Bridgeport, Conn., had the heftiest residential property-tax burden while Boston and Honolulu had the smallest among the cities included in the analysis. Reporters should note that cities ranking at the bottom tended to offer large homestead exemptions. For example, Honolulu offered an exemption of $80,000 of a home’s assessed value, according to the report.

- Cities with the highest effective commercial property tax rates were Detroit, New York, Chicago, Providence and Des Moines. The property taxes on a commercial structure valued at $1 million in Detroit, which had the highest tax burden of the urban cities used in the analysis, was $50,574.
- The lowest effective commercial property tax rates among urban cities were in Wilmington, Del., Virginia Beach, Seattle, Honolulu and Cheyenne, Wyo. The property taxes on a commercial structure valued at $1 million in Cheyenne, which had the lowest tax burden in the analysis, was $8,309.
- Tax rates on business property in New York City and Boston were at least four times higher than those for homes.
The report offers extensive details about property taxes across the country, and the authors stress that it is important to give this data context. Some areas are more reliant on property taxes than others, and residents and business owners pay taxes and fees that vary tremendously from place to place. “Some locations have relatively high property tax levies because those local governments are more dependent on ‘own-source’ revenue (revenue they raise themselves) or have limited non-property tax options available to them,” the authors state. “Other states have higher income and sales taxes in part to finance a greater share of the cost of local government.” Further complicating the issue is the substantial variation in home values between different states and cities. The owners of two physically identical homes in different states could be charged significantly different property taxes, even if the same property-tax rate is applied.
As journalists consider other angles to cover, here are other samples of useful studies on property taxes:
————————————–
“What Property Tax Limitations Do to Local Finances: A Meta-Analysis”
Martin, Isaac W. UCLA Institute for Research on Labor and Employment working paper, 2015.
Abstract: “Since California voters approved a state constitutional amendment to limit property taxes in 1978, most states in the United States have adopted legal limits on the annual increase of the property tax levy. Prior studies of the fiscal impact of property tax limitation on local government come to mixed conclusions. This study summarizes the literature with meta-regression analyses of the effect of property tax limitation on per capita property tax revenues, non-property-tax revenues, and total local revenues and expenditures. Aggregating estimates across studies provides better evidence that local governments are unable to circumvent limitations on property tax increases. Property tax limitations reduce property tax revenues. They may lead to compensatory increases in other taxes, but on average such increases do not fully make up for the foregone property tax revenue, and the net impact of a property tax limitation is therefore substantial fiscal constraint in the local public sector. By reducing the taxation of wealth and the spending on locally provided public services, property tax limitation may have a variety of perverse consequences for social life.”
“Homeowners, Renters and the Political Economy of Property Taxation”
Brunner, Eric J.; Ross, Stephen L.; Simonsen, Becky K. Regional Science and Urban Economics, July 2015, Vol. 53. doi: 10.1016/j.regsciurbeco.2015.04.001.
Abstract: “Studies find that renters are more supportive of public spending that is financed by the property tax than homeowners, a finding commonly referred to as the ‘renter effect.’ The renter effect suggests that, all else equal, renters should prefer property taxation over other forms of taxation. We test that hypothesis using detailed micro-level survey data that contains voter responses to two key questions: their willingness to pay higher property taxes to fund public services and their willingness to pay higher sales taxes to fund those services. Using a difference-in-differences estimation strategy, we find first that renters are approximately 10 to 18 percentage points more likely than homeowners to favor a property tax increase over a sales tax increase, a finding consistent with the presence of a renter effect. However, these results are not driven by the survey responses of renters. Analysis based on separate regressions for renters and homeowners reveals that renters are indifferent between a property tax increase and either a sales tax or state income tax increase, while homeowners strongly oppose a property tax increase relative to either a sales tax or state income tax increase. Further, the strong opposition among homeowners to the property tax is not eroded by including controls for income and other demographics as might be expected if these differences were driven by economic incentives. Finally, an examination of the variation in tax burden created by Proposition 13 in California shows no evidence that homeowner aversion to the property tax increases with the homeowner’s relative tax burden. These findings of homeowner aversion to property taxes are consistent with recent work suggesting that salience matters when voters evaluate taxes, but also suggest that increased salience does not necessarily lead to more careful consideration of individual tax burdens.”
“The Effect of Administrative Pay and Local Property Taxes on Student Achievement Scores: Evidence from New Jersey Public Schools”
Mensah, Yaw M.; Schoderbek, Michael P.; Sahay, Savita P. Economics of Education Review, June 2013, Vol. 34. doi: 10.1016/j.econedurev.2013.01.005.
Abstract: “We theorized that student test score performance will be positively related to the percentage of school district revenues raised from local taxes and with salary levels of school district administrators. Using both fixed and random effects panel analyses, we examine data for 217 Kindergarten-to-Grade 12 school districts in New Jersey for the years 2002-2009. Our results support the inference that increases in the percent of school funds raised locally have a positive influence on student test scores. However, the results for our hypothesis involving administrative costs were mixed. Administrative salaries and administrative spending were found to be positively related to test score performance in the one-way time fixed effects model, but not in the two-way models. Finally, classroom spending and the student–faculty ratio were found to be positive and significant in some of the tests, although not robust to alternative specifications.”
Keywords: Property value, property tax, ad valorum, millage rate, state funding, education funding, tax system, police, tax increase


Expert Commentary