


There is a band of water across the equatorial Pacific Ocean, stretching from the coast of South America through to the island nations of Southeast Asia, whose temperature climatologists closely monitor as a driver of global weather patterns.
Typically, warm water that settles around Indonesia during early spring works as an atmospheric engine, an energy source that affects weather patterns around the world for the coming year.
But every two to seven years, this atmospheric engine shifts. When unusually warm water settles instead off the western coasts of Mexico and South America during the spring, the moisture and energy released into the atmosphere can profoundly change regional weather, from North America and South America to Asia and Africa.
This phenomenon is part of a broader climate pattern called the El Niño-Southern Oscillation. The warm phase of ENSO is simply called El Niño. La Niña, its opposite, happens when those eastern Pacific waters are cooler than normal in the spring. A third, neutral phase, happens when Pacific waters are near average temperature.
As of mid-November, forecasters with the National Oceanic and Atmospheric Administration give a more than 55% chance of a strong El Niño this winter. Odds are 35% for a historically strong El Niño, like those that happened from 2015 to 2016, and 1997 to 1998. Odds are 62% that El Niño will persist into spring 2024.
The stronger an El Niño, the higher the likelihood of flood, drought and other regional weather consequences. This topic is relevant to environmental journalists and business journalists alike — and we’ve created this explainer to help reporters explain the consequences of this periodic weather pattern to their audiences.
Here is what this El Niño explainer will cover:
- How weather that deviates from regular expectations can have devastating economic consequences, particularly for people working in industries like fishing and agriculture who rely on some measure of climactic predictability.
- The findings of recent research that puts average global economic losses during El Niño years in the trillions of dollars.
- The effects of climate change on El Niño, which are poised to substantially increase that tally in the decades to come, research finds.
El Niño: ‘The most predictable climate driver’
El Niño and La Niña patterns last several months to a year, though sometimes longer. A strong El Niño is often followed the next year by a La Niña pattern.
“ENSO is the most predictable climate driver at seasonal timescales,” write the authors of a June 2021 paper in the journal Environmental Hazards.
But specific weather observed during past El Niño patterns may not appear in the same way during subsequent ones. While climatologists can predict an El Niño pattern with a high level of probability, precise regional effects are less predictable.
“Every El Niño is different,” says Christopher Callahan, a postdoctoral scholar of earth system science at Stanford University. “They all have slightly different patterns, or slightly different effects.”
In order to understand how El Niño stunts global economic growth and how it hampers local and regional economies, it will help to first understand predictions for regional weather based on historical analyses of this climate pattern, especially for journalists covering and communicating its effects over the coming months.
How El Niño can affect regional weather
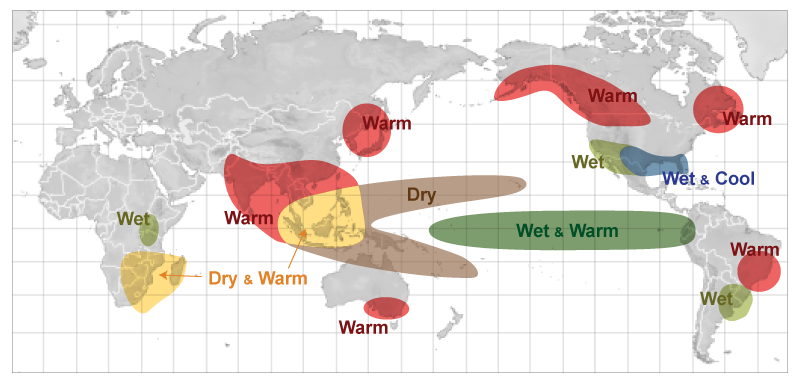
Past El Niño events have meant warm, dry air for Southeast Asia and northern Australia during the northern hemisphere’s winter months. Rain and cooler air appear in the southern U.S. during the winter months there.
In South America, countries situated in the northwest and along the mid-Atlantic coast have seen wetter, warmer weather. The Gulf of Alaska and western Canada have experienced warmer temperatures during past El Niño events. El Niño patterns can even alter shorelines, finds research published June 2023 in Nature Communications.
NOAA forecasters predict, as of mid-October, higher than usual temperatures in the U.S. Northwest and Northeast during the winter. Across much of the U.S. South, they predict equal odds of higher or lower temperatures. There’s a slightly greater chance of rain across the middle of the country and along the eastern seaboard, with higher chances of precipitation in the Southeast, the forecasters predict.
Climatologists and meteorologists deal in probabilities, and predictions are not certainties. Ten days is about as far as meteorologists can reliably predict when it comes to specific weather patterns. Climatologists study weather events and atmospheric patterns over the long term — anything greater than about two weeks.
“You look at these seasonal outlooks and such that are influenced by El Niño, and it might shift the odds to a 60% chance of heavy rains as opposed to the average, which might be a 33% chance,” says Emily Becker, associate director of the University of Miami Cooperative Institute for Marine and Atmospheric Studies. “That also still means there’s a 40% chance that you won’t have those heavy rains. That’s where El Niño’s information is provided — it’s in how the chances of certain events change. It never gives you a guarantee.”
How El Niño stunts global economic growth
Recent studies indicate El Niño patterns can significantly stunt economic growth. El Niño “drives considerable impacts that include El Niño-related droughts in western Pacific regions, floods in eastern Pacific regions and severe food shortage and cyclones to Pacific Island countries,” write the authors of a May 2023 paper published in Nature Reviews Earth & Environment.
In a paper published June 2023 in Science, Callahan and Dartmouth College geography professor Justin Mankin identify links between El Niño patterns and sluggish economic growth — to the tune of trillions of dollars in unrealized economic gains — and, in some countries, shrinking gross domestic product stemming from El Niño years.
Countries vary in exactly how they measure gross domestic product, but generally GDP refers to the market value of all goods and services a country produces in a given year. Stagnant or shrinking GDP is a strong indicator that a nation’s economic health is weak.
Many things affect GDP — technology, conflicts and labor supply, to name a few. But weather can also profoundly affect GDP, as extreme floods or drought may make previously fertile land un-farmable, for example.
Countries that have been most economically hurt during El Niño years tend to be lower income and in the tropical zone — Peru, Ecuador, Indonesia and the Philippines, among others, find Callahan and Mankin.
The key is teleconnections, which refers to the ways in which the introduction of something like a new energy source, such as warmer water, influences far away weather.
Peru, for example, is a highly teleconnected country when it comes to El Niño and La Niña — it’s in the South American tropics, right in the zone where warmer water settles during El Niño patterns.
Average yearly income there would have been nearly 20% higher in 2003 if not for the El Niño event five years earlier, find Callahan and Mankin.
Fisheries off the coast of Peru are “among the most productive in the world,” Callahan says. Usually, nutrient-rich cold water comes to the surface and encourages sea life to flourish, particularly anchoveta.
“During El Niño events, upwelling is limited by the warm water that’s sitting on top of the Pacific,” Callahan says. “And so those fisheries can get really devastated by these events.”
Globally, Callahan and Mankin attribute $5.7 trillion in unrealized economic gains, measured by GDP, over the five years following the 1997-to-1998 El Niño, along with $4.1 trillion associated with the 1982-to-1983 El Niño. For some countries, like Peru, El Niño hasn’t just meant unrealized gains — overall economic growth shrunk in the following years.
Callahan and Mankin note that the 1997-to-1998 El Niño was stronger than the 1982-to-1983 El Niño, and the world economy was larger in the late 1990s than in the early 1980s.
“El Niño events can produce extreme climate conditions that range from extreme rainfall to drought, to heat, to wildfire, to landslides to disease outbreaks,” Callahan says. “All of these things appear to sort of combine and integrate, to produce economic stress that lasts for five, or even up to 10 years, making these events far more costly than we realized.”
Wenju Cai, director of southern hemisphere oceans research at the Commonwealth Scientific and Industrial Research Organisation in Australia, and coauthors find similar economic consequences in a September 2023 paper published in Nature Communications.
Using an analysis slightly different from Callahan and Mankin, they estimate the global economy would have been $2.1 trillion larger over the following three years if not for the 1997-to-1998 El Niño, and $3.9 trillion larger if not for the 2015-to-2016 El Niño.
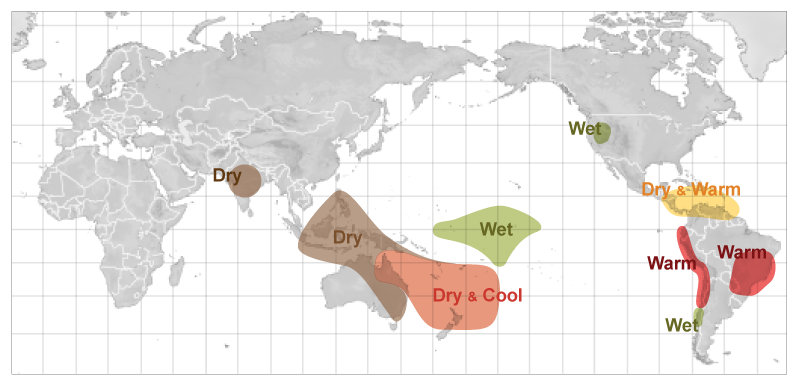
La Niña can bring catastrophic rains to Southeast Asia and nearby regions, including some of the worst flooding in the history of Queensland, Australia during the 2010 La Niña. But fisheries off the Pacific coast of South America tend to do well, and some La Niña events have been shown to modestly boost global economic growth. Cai and coauthors associate the 1998-to-1999 strong La Niña with $60 billion in global economic gains.
Crucially, they also estimate that strong El Niño patterns linked to continued high emissions of greenhouse gasses could mean an additional $33 trillion in global economic losses through the end of the century.
“Greenhouse warming is likely to increase frequency and intensity of extreme El Niño events,” Cai explained by email. “An El Niño typically leads to a global economic loss in trillions of US dollars. Thus, an increase in El Niño frequency and amplitude will lead to more frequent extreme weather events that are more devastating in affected regions, and globally a greater loss in economic production, particularly in developing and emerging economies.”
Flood, drought and disease from El Niño patterns
While El Niño patterns tend to hamper the global economy, they can also be costly for local and regional economies. Take the southern U.S.: El Niño years often mean more rain than usual there, and flooding is the “most common and damaging natural disaster” in the U.S., write the authors of a July 2019 paper published in Weather, Climate and Society.
Using four decades of insurance claims from the National Flood Insurance Program — 82,588 claims and $1.6 billion paid — the authors find just 1% of extreme floods resulted in more than two-thirds of losses from 1978 to 2017 across the western U.S.
The 1982-to-1983 and 1997-to-1998 El Niño patterns resulted in more than $1.4 billion in estimated damages from floods, according to past research the authors cite.
Estimated damages often exceed insurance losses because some people choose not to buy flood insurance.
While damage estimates and insurance losses differ in scale, the authors show that they tend to rise and fall concurrently during and after floods.
With $172 million and $106 million in insured losses, Sonoma, California, and Los Angeles were the most affected counties in the dataset.
“In coastal Southern California and across the Southwest, El Niño conditions have had a strong effect in producing more frequent and higher magnitudes of insured losses, while La Niña conditions significantly reduce both the frequency and magnitude of losses,” the authors conclude.
El Niño and other regional climate patterns can also bring heavier than usual rains to the countries of eastern Africa, find the authors of a July 2020 paper published in Atmospheric and Climate Sciences.
Drowned crops and livestock can be devastating for farmers in those countries.
“The livelihood and socio-economic development of majority of the people in East African countries including Tanzania, Kenya, Uganda, Burundi and Rwanda largely depend on rain-fed agricultural activities,” write the authors. “The region is often affected by incidences of climate and weather extremes and is among the most flood-prone countries in Africa.”
For Zambia, a landlocked country in southern Africa, the strong 2015-to-2016 El Niño pattern brought severe drought, “which caused crops to fail shortly after planting and resulted in region-wide food deficit warnings,” write the authors of an April 2021 paper in Environment and Development Economics.
The country particularly relies on maize for food and commerce. Since the 1990s, Zambian farmers have used sustainable land practices, such as crop rotation and soil and water conservation, according to the paper. Because El Niño patterns are generally predictable months in advance, farmers there were able to diversify production — but it wasn’t enough to make up the income from lost crops.
“We find that maize yields were substantially reduced and that household incomes were only partially protected from the shock thanks to diversification strategies,” the authors conclude. “Mechanical erosion control measures and livestock diversification emerge as the only strategies that provided yield and income benefits under weather shock.”
The results of a June 2020 paper in the journal Quaternary looks at drought data in Thailand over the past 2,000 years and finds mixed results as to whether El Niño patterns bring drought there. The authors conclude that “droughts are not a product of one climate pattern, but likely the result of numerous patterns interacting.”
Communities in the Costa Rican province of Guanacaste “suffer from recurrent droughts, often related to El Niño,” write the authors of a September 2021 paper published in Water Resources Research. El Niño-driven droughts are likely to severely reduce local water supplies, they find. The authors use hydrological modelling to estimate a 60% decline in streamflow and groundwater during an extreme El Niño pattern, with the nearby ocean temperature rising 2.5 degrees Celsius higher than usual.
La Niña, by contrast, brings intense storms to the province, which can help recharge groundwater aquifers, but are also “characterized by high sediment loads and often rush through the watersheds within hours,” the authors write.
“A key result is that with business-as-usual water use in combination with population growth and a change toward a drier climate … a decline in groundwater storage may be expected,” they conclude. “This would have substantial consequences for communities and agriculture that rely on groundwater especially during the long dry season.”
Flooding, extreme storms and fires related to El Niño patterns can make transportation difficult or impossible, with higher risks during El Niño years that roads, rail and other infrastructure could be wiped out in California, Hawaii and U.S. Pacific territories, finds research published December 2021 in Progress in Disaster Science.
Finally, El Niño patterns affect not just land and infrastructure, but have also been linked to disease outbreaks. Southeast Asia, Tanzania, the western U.S. and Brazil all saw disease outbreaks linked to the 2015-to-2016 El Niño, find the authors of a February 2019 paper in Scientific Reports. These outbreaks included plague in Colorado and New Mexico, cholera in Tanzania and dengue in Brazil.
“Extreme climate conditions, such as flooding associated with severe storms and natural disasters such as hurricanes, typhoons, or earthquakes, can disrupt water systems — exposing drinking water to waste water and other effluents — thus increasing the risk of cholera activity and other water-borne infections,” the authors write.
How climate change affects El Niño patterns
The science is settled that the world is warming at a historically fast rate due to humanity’s inventions, such as gasoline-powered vehicles and electric power.
“Human activities, principally through emissions of greenhouse gases, have unequivocally caused global warming, with global surface temperature reaching 1.1 [degrees Celsius] above 1850 to 1900 levels in 2011 to 2020,” write the authors of a 2023 summary report for policymakers from the United Nation’s Intergovernmental Panel on Climate Change.
While scientific consensus is not there when it comes to how climate change affects El Niño patterns, recent research explores specific links between global warming caused by humans, which is known as anthropogenic warming, and increasing variability in Pacific Ocean temperatures that fuel El Niño conditions.
The May 2023 paper in Nature Reviews Earth & Environment uses statistical modeling techniques to explore the effects of global warming on El Niño and La Niña patterns over the past 120 years — Cai is lead author.
This type of analysis is common in climate science research and is based on a complex series of computer models that simulate weather conditions. The authors acknowledge that when it comes to the intensity of El Niño and La Niña patterns, real-world data only goes back decades and is lower quality before the 1950s.
Still, they write that “determining the anthropogenic contributions to changing ENSO variability is vital to attribute causes of extreme events that are becoming more frequent and severe to understand ENSO projection and to gauge urgency of mitigation actions.” Cai also notes in an email to The Journalist’s Resource that the modeling approach used in the paper is the same as what the IPCC uses.
The authors find more than three-fourths of models show more frequent, stronger El Niño and La Niña patterns from 1961 to 2020 compared with 1901 to 1960. Taken together, the modelling results and other evidence in the paper “suggest that the increase in observed ENSO variability post-1960 is at least in part related to anthropogenic warming,” the authors write.
And it’s not just that models indicate El Niño patterns are likely becoming stronger. Global warming creates conditions that can exacerbate the effects of those patterns.
“For example, in areas where El Niño causes drought, higher air temperature due to greenhouse warming increases evaporation, so drought onset is earlier, drought is more severe, and drought is harder to get out,” Cai explained by e-mail. “In areas where El Niño causes flood, warmer air holds more water vapor, making the flood more extreme.”
The authors of another recent paper, published October 2023 in Geophysical Research Letters, examine the geologic record contained within stalagmites from southeastern Alaskan caves to analyze the core causes of El Niño patterns over millennia.
Climate in the Northeast Pacific is very influenced by water temperature in the equatorial Pacific — this is a teleconnection, a “pattern of influence,” as Callahan puts it, where a change in the atmosphere or water in one part of the world affects weather in another. The Aleutian Low, a low-pressure pattern that lingers over the Gulf of Alaska for much of the year, is stronger when the equatorial Pacific Ocean is warmer, bringing more rain than average to the southern Alaskan coast and northwestern Canada.
Stalagmites, which rise from a cave floor, and stalactites, which grow down from a cave roof, are part of the mineral deposit family known as speleothems. These deposits are “excellent at capturing atmospheric conditions over the past 3,500 years,” the authors write. Through the flow of water into and out of the cave and the natural dripping of water from cave roof to floor, the authors were able to look back in time at the existence of El Niño and La Niña patterns.
“It’s recording stable isotopes trapped in the rock, particularly Oxygen-18, which derives from precipitation,” says lead author Paul Wilcox, a postdoctoral researcher with the Innsbruck Quaternary Research Group in Austria. “Typically, we can only access that isotope by drilling small bits of powdered rock from the stalagmite, but this sample was unique in that it also contained trace amounts of water. It’s difficult to get that in a lot of records, and we were lucky enough to have samples that had enough water and grew fast enough to piece together a high-resolution record of ancient precipitation.”
Parts of the stalagmite sample with relatively high levels of Oxygen-18 indicate a weaker Aleutian Low — meaning that while that part of the stalagmite was forming, El Niño events were probably happening less frequently. Likewise, lower levels of the oxygen isotope indicate a stronger Aleutian Low, and the likely presence of more persistent El Niño patterns.
The other key part of this study has to do with solar irradiance, which is a measure of the naturally fluctuating energy from the sun that reaches the top of the earth’s atmosphere. Solar irradiance was the driving force behind El Niño and La Niña patterns for 2,000 years, until the 1970s, the authors find. They link La Niña patterns with more solar irradiance, and El Niño patterns with less solar irradiance.
Through satellite imagery and other measures, climatologists since the 1960s have known that the movement of air and water in different parts of the Pacific are not independent and random, but rather part of a larger system.
That system has changed, with connections between wind, water and atmosphere across the Pacific weakening since the 1970s. The authors point to data from the stalagmite as indicating that this change is linked to the remarkably high emission of carbon dioxide into the atmosphere, stemming from human activity since the Industrial Revolution.
“There is a noticeable change in El Niño and La Niña variability that’s been known for several decades,” Wilcox says. “The problem is, there was too short of a record to really pinpoint if humans were causing this change or not. And this is where geologic records like the one we produced helps — kind of really more convincingly shows that this was likely human caused.”
Of the five strong El Niño events since 1901, three have happened since the 1970s, according to a September 2019 paper in the Proceedings of the National Academy of Sciences. Similar to a December 2019 paper in Geophysical Research Letters, the authors of the PNAS paper identify a westward shift since the 1970s in the “warm center” that catalyzes El Niño patterns, coinciding with “a rapid warming in the Indo-Pacific warm pool,” which they note may or may not be due entirely to human activity.
Still, if temperatures in the western Pacific continue to warm, and if greenhouse gases continue to be emitted at current rates, “more frequent extreme El Niño events will induce profound socioeconomic consequences,” the authors write.
Expert Commentary