After Donald Trump started his second presidential term in January, his administration began purging federal government websites of data and information on topics such as racial diversity, LGBTQ rights and gender identity.
He vowed to dismantle the U.S. Department of Education and slashed staffing and funding at the agency’s independent research arm, the Institute of Education Sciences. The institute runs the National Center for Education Statistics, a primary source of education data for researchers, journalists and educators nationwide that, as of mid-March, had a “a skeletal staff of just three” people, according to the education news outlet The Hechinger Report.
Two weeks ago, the Trump administration fired 13 members of the institute’s advisory board, comprised of 15 voting members who are education scholars and other experts. A spokeswoman for the Department of Education told TIME magazine the board members had failed to ensure the institute’s activities were “objective, nonideological, and free of partisan influence,” Nik Popli, a political journalist at TIME, reported June 4.
Leading education researchers have spoken out with worries about how these and other recent changes will affect the quality and quantity of education data going forward. Major research organizations such as the American Educational Research Association have sued the federal government to try to reverse those changes and prevent further cuts.
Jill Barshay, who writes a weekly column about education data and research for The Hechinger Report, noted Monday that the Education Department missed its annual deadline for giving Congress a lengthy statistical report called “The Condition of Education.”
It was the first time the Education Department missed its June 1 deadline, mandated by Congress in 2002. For almost 160 years, the federal government has produced an annual report providing legislators with updated data on all levels of education in the U.S.
“I thought it was a small but illuminating example of how the department is unable to keep up with its statutory obligations because it no longer has the personnel and contracts in place to do the work,” Barshay writes in her “Proof Points” column.
High-quality data in a time of uncertainty
The uncertainty around federal data forces journalists to find other sources of data for stories about public school districts, charter schools, private schools and homeschool programs and the students they serve.
Thankfully, news outlets can turn to nonprofit research organizations for help. Many of these organizations, which include university research centers, have collected federal government data going back years or even decades. Often, they make that information publicly available, along with K-12 education data they have collected themselves.
Although it’s unlikely the data from nonprofit research organizations will replace all the government data that has vanished or could be delayed, it can fill in gaps. To further help, some of these organizations have created free online tools to make it easier for journalists to examine multiple datasets at once to identify trends and draw comparisons.
Below, we spotlight 10 of these free data tools, some of which were featured during the recent panel discussion “Essential K-12 Data Sources — and How to Mine Them for Stories,” held at the Education Writers Association’s national conference in St. Louis. The two panelists who spoke were Sean Reardon, the endowed Professor of Poverty and Inequality in Education at Stanford University, and Jay Carter, a senior research associate at the Urban Institute and the team lead for its Education Data Portal.
These 10 tools examine topics such as student test scores, school segregation, immigrant children, school bullying, dual enrollment, youth voting and private school student demographics. Most allow journalists to create maps, charts, lists and other data visualizations that they can incorporate into their news coverage.
All of these tools rely at least partly on data from federal agencies, including the U.S. Department of Education and U.S. Census Bureau. While some focus on a single topic or a group of related topics, others examine an array of topics.
Tools that examine a range of K-12 topics
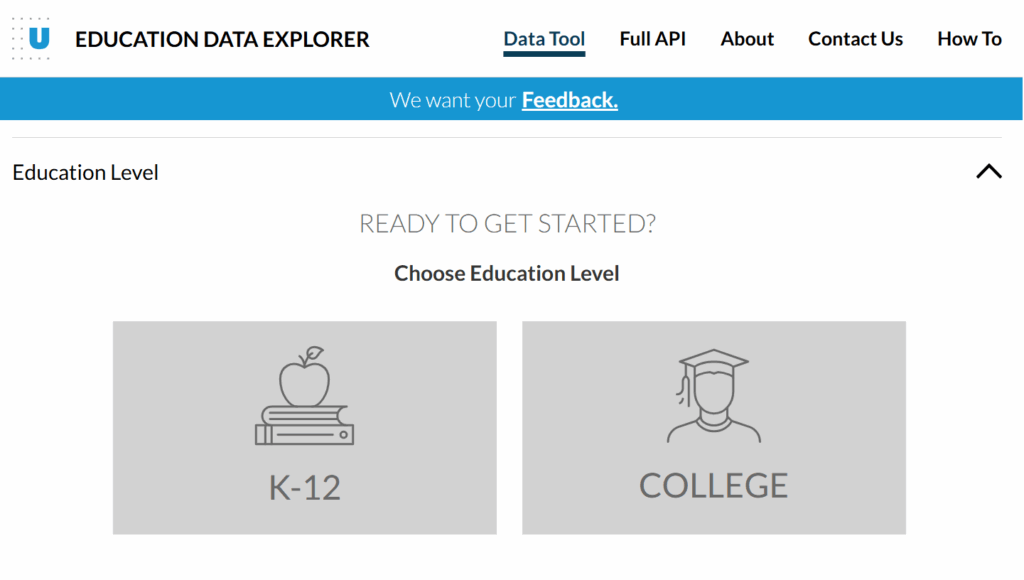
This interactive tool from the Urban Institute, a non-profit think tank that conducts social and economic policy research, provides a range of data at both the school district and school level from 1986 to 2023. Journalists can find data on K-12 student characteristics, education finances, reports of bullying, student enrollment in Advanced Placement courses and high school graduation rates. The tool also offers data on the number of teachers, classroom aids, librarians and other full-time employees who work in each school and school district.

Journalists can download data directly from the Education Data Explorer’s Application Programming Interface or access data sets using Stata, a commercially-available statistical software package, or R, a free, open-source statistical programming language. The Urban Institute provides a video tutorial to help people use the platform.
Opportunity Insights, a nonprofit research organization co-led by Harvard University economist Raj Chetty, developed a platform called the Opportunity Atlas. It allows journalists to investigate the relationship between the characteristics of local neighborhoods and children’s future achievements. The data analysis platform aims to answer this key question: Which U.S. communities offer kids the best chance to rise out of poverty?
“See where and for whom opportunity has been missing, how it is changing, and use this data to inform local solutions to help more children rise out of poverty,” researchers write on the platform.
The platform analyzes a variety of data, including U.S. Census data and other federal data, to track children who grew up in the U.S. in the 1980s and 1990s. Journalists can find information about how kids’ futures — for example, their marriage rates, college graduation rates, household income levels, incarceration rates and how many children they have as adults — are linked to the neighborhoods where they grew up. Journalists can download data sets directly from Opportunity Insights’ data library.
Student achievement data
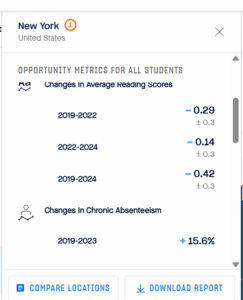
This project, a collaboration among researchers at Stanford, Harvard and Brown universities, examines changes in student test scores in 43 states during and after the COVID-19 pandemic. Researchers have gathered student scores on two types of standardized test: the exam each state administers to its students annually and the National Assessment of Educational Progress, an exam mandated by Congress that public and private school students in grades 4, 8 and 12 take each year.
The data and interactive maps on this website represent public school students in grades 3 to 8 who were tested in math or reading from 2019 to 2024. Journalists can use them to find trends in student achievement and compare the performance of students by race and ethnicity, economic status and their school district’s rate of chronic absenteeism. Test scores for students in Alaska, Colorado, Maine, Montana, New Mexico, New York, Oregon and Vermont are not included because of data limitations, according to the website.
The Education Recovery Explorer

This platform is part of Stanford’s Educational Opportunity Project. It provides much more detail about the students and standardized test scores featured in the Education Recovery Scorecard.
Journalists can use the interactive platform to examine changes in math or reading scores from 2019 to 2024 and gain insights into how factors such as federal funding, chronic absenteeism, remote learning and students’ household incomes affected their test scores. Stanford will give journalists and others immediate access to full data sets if they provide an email address and abide by its data use agreement.
Midwestern Higher Education Compact Interactive Dashboard
Journalists can use this tool, developed by researchers at the nonprofit Midwestern Higher Education Compact, to find a variety of student achievement indicators for students living in 12 Midwestern states: Illinois, Indiana, Iowa, Kansas, Michigan, Minnesota, Missouri, Nebraska, North Dakota, Ohio, South Dakota, and Wisconsin.
For example, journalists can look at the percentage of students in each of these states who attended preschool or demonstrated proficiency in eight-grade math, reading and science. Journalists can also see the proportion of students who earned a certain score on the SAT and ACT college-entrance exams.
The years of data included in each dataset vary. But data for K-12 students generally span from the early and mid-2000s to the early 2020s.
Racial and economic segregation
The Segregation Tracking Project
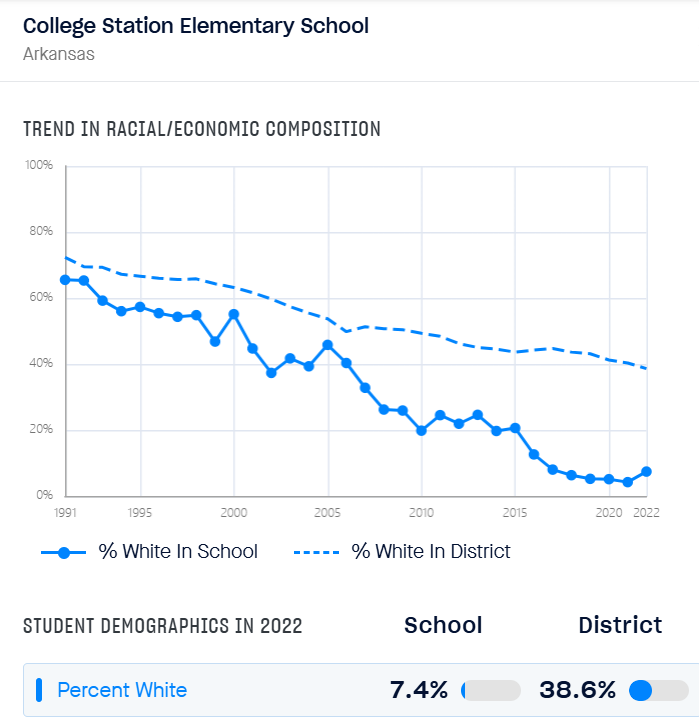
Journalists can use this platform to examine racial, ethnic and economic segregation across U.S. neighborhoods and public schools from 1991 to 2022. Although laws requiring people to be separated by race were abolished by the end of the 1960s, many neighborhoods and K-12 schools remain highly segregated along racial, ethnic and socioeconomic lines because of housing patterns, school attendance zones and other factors.

This project, a collaboration between the University of Southern California and Stanford University, provides interactive maps that demonstrate segregation at the state and local levels over time. Journalists can look at Black-white segregation, Hispanic-white segregation or Asian-white segregation. They can also examine segregation of white residents from all non-white residents.
The platform also shows economic segregation, based on the percentages of children who do and do not qualify for free meals under the federal government’s National School Lunch Program.
Stanford will give journalists and others immediate access to data sets used for this project if they provide an email address and accept the terms of its data use agreement.
Dual enrollment
Dual Enrollment Student Outcomes
The Community College Research Center at Columbia University collects data on students who participate in dual enrollment programs, which generally allow high school students to take college courses for free. Most dually enrolled students attend their local community college.
Researchers developed an interactive dashboard that shows how many dually enrolled students go on to earn a college degree after graduating high school. The tool provides a state-by-state look at students who began participating in dual enrollment programs in fall 2015, broken down by students’ gender, race, ethnicity and neighborhood income level. Journalists can use the tool to find out how many of those students kept taking college courses one year after high school and how many had completed a degree five years after high school.
Data for the project came from the National Student Clearinghouse, a nonprofit organization that provides detailed information on U.S. college student enrollment, and the U.S. Department of Education’s Civil Rights Data Collection.
Immigrant student data
Children of Immigrants Data Tool
This interactive tool from the Urban Institute allows journalists to create data tables to accompany stories about immigrant children living in the U.S. Reporters can find data on the age, race and ethnicity of these youth as well as their country of origin, citizenship status, level of English proficiency and family income.
The tool also provides various data on immigrant children’s families, including family size, parent education levels, parent citizenship status, whether the household has access to a vehicle, whether anyone in the household is a military veteran, and whether the family receives food stamps.
Private school data
Investigative news outlet ProPublica created this searchable database to make it easy for the public to find information on the race and ethnicity of private school students nationwide. Journalists can use it to also compare the demographics of private schools to those of public schools in the same area.
ProPublica reports that federal data generally show that private schools have a much larger percentage of white students than public schools do. But there is considerable variation from place to place.
Most data that ProPublica used for this project came from the National Center for Education Statistics, a federal agency that collects various information from U.S. private schools every two years. It released data for the 2021-22 academic year in December 2023.
Youth civic engagement
Youth Voting and Civic Engagement in America
This online tool from Tufts University’s Center for Information & Research on Civic Learning and Engagement lets journalists delve into data on civic engagement among young adults, including high school students ages 18 and older.
Journalists can examine the political preferences and turnout rates of so-called “youth voters” at the national and local level. They can also compare states across 10 indicators of youth civic engagement, including volunteering and contacting public officials.
This resource relies heavily on survey data from the U.S. Census Bureau and Edison Research, a private firm known for conducting exit polls during elections. Data is available for the following years: 2016, 2018, 2020 and 2022.


Expert Commentary