


Northern states have provided a shrinking supply of military recruits over the past four-plus decades, while the south’s contribution has grown. Washington, D.C., North Dakota and Massachusetts send the fewest recruits per capita into the armed services.
These and many other demographic and personnel trends can be gleaned from an annual report on who serves – “Population Representation in the Military Services” – published by the Office of the Under Secretary of Defense, Personnel and Readiness (the Pentagon’s HR department). The Senate mandated the annual report in 1974 and in recent years it has been prepared by a contracted think tank known as CNA (formerly the Center for Naval Analyses).
The latest report covers fiscal year 2015 (ending on September 30, 2015). A 66-page executive summary outlines the findings, but researchers and journalists looking for specific data should turn to the neatly labeled appendices. Listed on a separate page are the data sources. With statistics dating back to the 1970s, you can use the data to map changes over time.
Some key takeaways:
- The financial crisis and subsequent high levels of youth unemployment in the years since 2009 have allowed military recruiters “to be increasingly selective, resulting in very high quality newly enlisted recruits.” High-quality enlistees are defined as those who have completed high school and score well on a qualification test. The rate falls when the military grows more desperate to fill its ranks. Currently, the Army is the least selective, followed by the Marine Corps, the Navy and the Air Force.

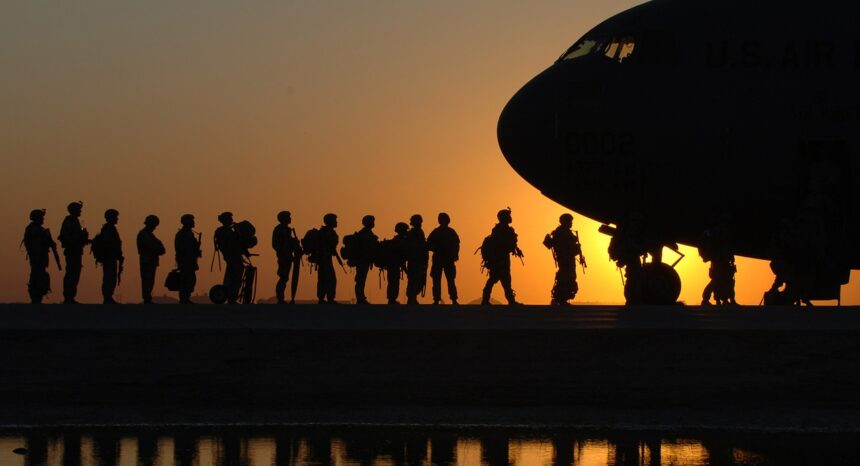
- Since the military abandoned the draft in 1973, when the U.S. withdrew from Vietnam, the number of active duty service members has fallen from about 2.2 million to 1.3 million.
- Among new female enlistees (i.e. not officers) in the Army who have not previously served, 37.2 percent are black. Among civilian women in the similar age group (18-24), 16.1 percent are black.
- The ratio of women to men in both the officer corps and the enlisted ranks has grown steadily since the 1970s. The greatest gains were seen in the Navy, where the ratio of newly enlisted females grew from 3 percent in 1970 to 25.1 percent in 2015. In the Air Force, female officer commissions increased from 7.5 percent in 1973 to 26.7 percent in 2015, making the Air Force the service with the highest ratio of female officers.
- In the Army, 77.9 percent of commissioned male officers are white; in the Navy, 81.4 percent; in the Marine Corps, 82.2 percent; and in the Air Force, 82.7 percent. In the college-educated male population at large (officers generally must graduate college to be commissioned), 78.6 percent are white.
- The female officer corps tells a different story: 21.8 percent of female Army officers are black; in the Marine Corps the figure is 6.5 percent; and in the Air Force it is 11.4 percent. In society at large, 10.8 percent of female college graduates are black.
- Marine Corps enlistees are largely white, at 83.1 percent. But government methodology can be confusing; because at the same time, 24.4 percent of Marine Corps enlistees are Hispanic.
- Compared with recruits from the other services, Army enlistees are from the poorest households; 44.4 percent come from the poorest two-fifths of households. Air Force enlistees come from the wealthiest homes, relative to the other services.
- The Air Force has the highest ratio of officers to enlisted airmen, at about 4 to 1. The Marine Corps has the lowest ratio, at about 8.8 Marines to one officer.
- The home region of active-duty service members shifted markedly between 1973 and 2015. The percentage from northeastern states fell from 18.1 to 12.6 percent; in north central states, from 27.2 to 18.7. In the same period, shares from the south and west have grown, from 35.3 percent to 43.8 and 18.7 percent to 23.7, respectively. (These values are not entirely explained by population shifts.)
- California and Texas provide the U.S. military with the most new recruits, at 13.5 and 10.2 percent of the total, respectively. But, per capita, Georgia, Florida and South Carolina provide the most and Washington, D.C., North Dakota and Massachusetts the fewest. Put another way, an 18- to 24-year-old Oregonian is twice as likely as a North Dakotan to enlist; a Georgian is three times as likely as the North Dakotan.

Other resources:
Government offices with extensive data on veterans and military households include the Census Bureau, the Department of Veterans Affairs and the Defense Manpower Data Center.
There is little comprehensive data available on military contractors, who have taken far-reaching roles in the post-9/11 wars, and often outnumber soldiers on the ground. They perform jobs like feeding troops and logistics to training foreign militaries. This January 2016 Defense Department report estimates there were over 43,000 defense contractors in the Middle East working on Pentagon contracts at the time, about 40 percent of them Americans and 28 percent “third-country nationals” (people from outside the region who are not American citizens). This does not include the thousands of contractors working for the State Department or other government agencies. The University of Denver has a project on private security contractors – those who engage in fighting (sometimes known as “mercenaries”) and/or train foreign militaries.
The Congressional Research Service, in April 2017, reported on defense contractor and troop levels in Afghanistan and Iraq over the previous ten years.
Any reporter covering the military for the first time may struggle with some of the lingo: who is a soldier, an officer, a corporal or a captain, for example. This Pentagon resource helps with ranks and insignias.
Expert Commentary