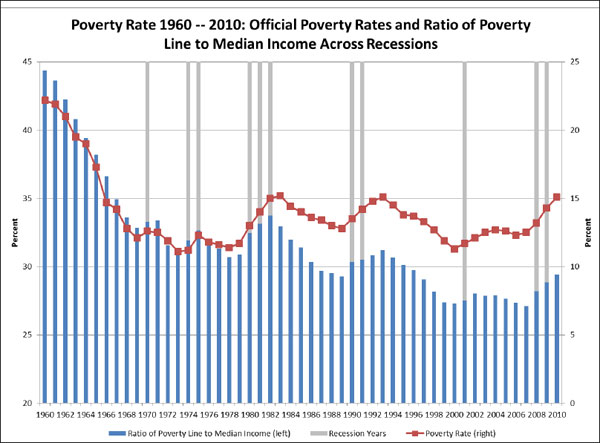
In 2010 and 2011, the rate of poverty in the United States stayed roughly constant at 15% — some 46.2 million people, according to Census Bureau figures issued in September 2012. This represents the greatest total number of people designated as poor since the government began the count more than a half-century ago.
The official poverty threshold for a family of four in 2011 was $23,021, a weekly paycheck of $443. However, scholars have long pointed out the shortcomings of the methods used for measuring poverty, and the U.S. government has begun to experiment with new, non-official models that show poverty is a deeper problem than is suggested by traditional counts.
For the official 2011 figures, the Census Bureau notes:
- “In 2011, 6.2% of married-couple families, 31.2% of families with a female householder and 16.1% of families with a male householder lived in poverty.”
- “The poverty rate for males decreased between 2010 and 2011, from 14% to 13.6%, while the poverty rate for females was 16.3%, not statistically different from the 2010 estimate.”
- “In 2011, the family poverty rate and the number of families in poverty were 11.8% and 9.5 million, respectively, both not statistically different from the 2010 estimates.”
Though the total number of U.S. residents living in poverty is at a record high, the country has seen prior periods where the rate was at least as high. As illustrated by the graphic below — courtesy of a 2011 presentation by scholars at a National Academies of Science workshop — these periods typically coincide with economic recessions:
For a look at poverty dynamics specifically in an urban context, see this review of relevant studies and reports.
Below are several related reports and papers that can help journalists interpret general poverty figures and frame stories according to the latest data. A special thanks to the Russell Sage Foundation, which promotes research in this area:
______
“2012: A Consumer’s Guide to Interpreting Various U.S. Poverty Measures”
Johnson, David; Smeeding, Timothy. Institute for Research on Poverty, University of Wisconsin-Madison, May 2012.
Abstract: “Each year, the U.S. Census Bureau releases a number of public reports on the level of poverty in the previous year and trends in the level and composition of the poor from year to year. To make their annual assessment, Bureau analysts use the official poverty measure that was created around the time when President Lyndon Johnson launched the War on Poverty in 1964. The measure was devised to define and quantify poverty in America and thereby provide a yardstick for progress, or regress, and in that sense has served the nation well. However, since the measure’s inception, criticisms of it have abounded, as have suggestions for alternative approaches. While continuing to use the official measure, the Census Bureau also has pursued ancillary measures, most recently the Supplemental Poverty Measure, whose first results were released in November 2011. In addition, the Census Bureau and many state and local entities have devised their own, place-specific measures, in an attempt to better understand the level and trend of poverty in their region and to gauge the effectiveness of antipoverty efforts.”
“Poverty in the United States: 2011”
Gabe, Thomas. Congressional Research Service, September 13, 2012.
Findings: “Since 2006, when the poverty rate stood at 12.3%, marking its most recent low, the number of poor has grown by 9.7 million persons. The 46.2 million persons counted as poor in both 2011 and 2010 are the largest numbers counted in the measure’s recorded history, which goes back as far as 1959. The 2011 poverty rate of 15.0%, statistically tied with the 2010 rate, is the highest seen in the past 18 years (1993). The increase in poverty since 2006 reflects the effects of the economic recession that began in December 2007.2 The level of poverty tends to follow the economic cycle quite closely, tending to rise when the economy is faltering and fall when the economy is in sustained growth. This most recent recession, which officially ended in June 2009, was the longest recorded (18 months) in the post-World War II period. Even as the economy recovers, poverty is expected to remain high, as poverty rates generally do not begin to fall until economic expansion is well underway. Given the depth and duration of the recession, and the projected slow recovery, it will take several years or more before poverty rates recede to their 2006 pre-recession level.”
“Research Supplemental Poverty Measure: 2010: Consumer Income”
Research brief, U.S. Department of Commerce and the Census Bureau, November 2011.
Findings: A new model being employed by the government on a working basis, called the Supplemental Poverty Measure (SPM), incorporates a host of significant shifts in family income and expenses (including rising core expenses, standards of living, and geographic variations in expenses not reflected in official poverty level calculations.) According to this new model, 49 million Americans live in poverty, an increase from the figure of 46.2 million reflected in the earlier 2011 Census numbers (calculated according to the older official formula.) This new measure puts the percentage of those in poverty at 16%, as opposed to the official number of 15.1%. The SPM guidelines put the poverty level at $24,343 for a family of four, compared with $22,113 under the older model. Of all those in poverty, the numbers expanded for those of working age — those between the ages of 18 and 65 — made up 59.5% of people in poverty (in contrast to 56.3% under official measures). Moreover, the percentage of residents 65 and older in poverty also rose using this new method of calculation, from 7.6% to 12.7%.
“At Risk: America’s Poor During and After the Great Recession”
Seefeldt, Kristin, et al. School of Public and Environmental Affairs, Indiana University, January 2012.
Findings: “Large numbers of Americans are already poor. The official federal measure of poverty and a new ‘Supplemental Measure,’ which accounts for several shortcomings in the official measure, both reveal a sobering fact: poverty in America is remarkably widespread. In 2010, about 46.2 million Americans were living in poverty according to the official measure, or about 15.1% of the U.S. population. The rate of poverty is slightly larger (16%) using the supplemental measure. The five states with the highest rates of poverty are somewhat different according to the two measures (2009): Mississippi (23.2%), Arizona (21.3%), New Mexico (19.6%), Arkansas (19.1%), and Georgia (18.5%), according to the official measure; California (22.4%), Arizona (21.6%), Florida (19.5%), Georgia (18.8%), and Hawaii (18.0%), according to the supplemental measure. The supplemental measure accounts for geographical differences in the cost of living and thus gives more emphasis to poverty in urban areas, where day-to-day living costs, especially housing, are higher than they are in rural areas…. The number of people living in poverty is increasing and is expected to increase further, despite the recovery. The proportion of people living in poverty has increased by 27% between the year before the onset of the Great Recession (2006) and 2010. During the same period (2006-2010), the total population of the United States grew by less than 3.3%. The official national estimates of people in poverty have risen each year since 2006: 36.5 million (2006), 37.3 million (2007), 39.8 million (2008), 43.6 million (2009), and 46.2 million (2010). Poverty is expected to increase again in 2011 due to the slow pace of the economic recovery, the persistently high rate of unemployment, and the long duration of spells of unemployment…. The recent increase in the rate of poverty has not been uniform across subgroups. The increase in poverty since 2006 has been greater among Hispanics and African Americans than among Whites, greater among children than among the elderly, and greater among female-headed households than other households. More surprising, however, is the growth in poverty among working-age adults, especially younger people between the ages of 18 and 34.”
“Recent Developments in Antipoverty Policies in the United States”
Ziliak, James P. Institute for Research on Poverty, University of Wisconsin-Madison, September 2011.
Abstract: “I survey recent developments in antipoverty policy in the United States over the past decade and examine how the safety net and tax system affect poverty and its correlates using data from the 2000 to 2010 waves of the Current Population Survey Annual Social and Economic Supplement. Unlike the 1980s and 1990s, and until the health care overhaul in 2009, the first decade of the 21st century was relatively tepid in terms of major transfer policy reforms. However, real spending on most major social programs increased significantly, and in some cases doubled or tripled, in response to demographic shifts and the deep recession. In spite of the real growth in social insurance and means-tested transfer programs, the trends in after-tax and transfer poverty rates were little affected, and if anything, suggest that the safety net has lost some of its antipoverty bite in terms of alleviating hardship among those living in deep poverty.”
Tags: poverty, research roundup, race, African-American, Latino, youth


Expert Commentary