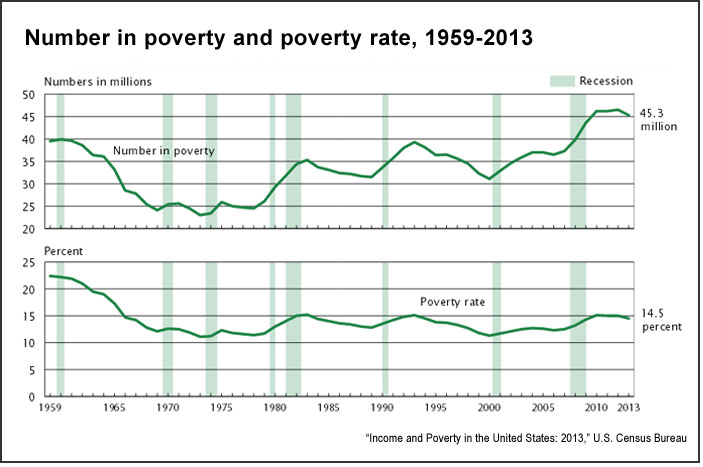
The overall U.S. poverty rate has hovered around 12% to 15% since the 1970s, and figures announced in 2014 by the U.S. Census Bureau do not suggest a sea change: In 2013, 14.5% of Americans lived below the poverty line, defined as $23,830 for a family of four in 2013, or $11,890 for an individual.
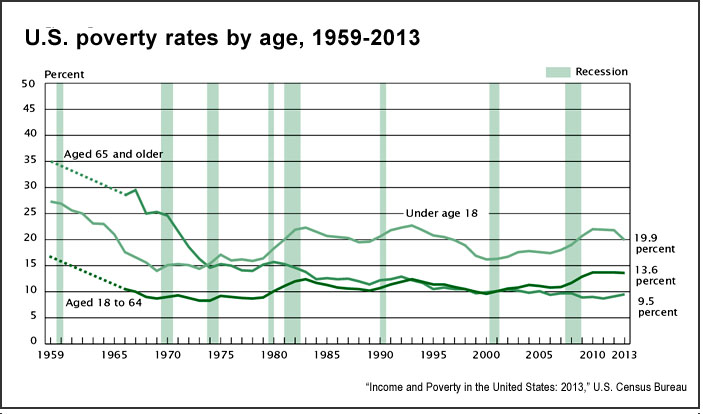
This overall figure is down slightly from 2012 levels (15%), and the Census reports some additional positive progress: “The poverty rate for children under 18 fell from 21.8% in 2012 to 19.9% in 2013.” Still, about 45.3 million Americans remain in poverty. In this respect, it appears the nation has still not fully recovered from the Great Recession, as the poverty rate remains 2 points higher (12.5%) than it was just prior to the financial crisis, in 2007.
The relative stagnation in these numbers frequently raises questions about whether policymakers are taking the right approach to the problem. Despite criticism that social programs have done little to help America’s underclass — on the surface, it seems that entitlements have not changed underlying dynamics — some recent research suggests that the poverty rate would be much higher if not for government programs and safety nets (this includes food stamps, now called SNAP, or Supplemental Nutrition Assistance Program). Further, there is an ongoing debate about how to properly measure poverty, and researchers have looked at different statistical tools, such as the Supplemental Poverty Measure, in an attempt to establish trends more precisely.
The latest report from the Census Bureau includes several tables that provide context and historical perspective on issues of poverty:
It is worth noting that certain demographics, such as those under 18 and those over 65, are much more vulnerable to poverty:
Keywords: poverty, children, aging, youth, inequality


Expert Commentary