


Federal Reserve economists produce valuable research on various topics, and Federal Reserve Chair Jerome Powell is often in the news, recently for reassuring stock and bond investors that target interest rates would remain historically low. Powell rattled markets days later by suggesting the nation faced a long jobs recovery ahead.
But the nation’s central bank is more than the chair and the Federal Reserve Board of Governors in Washington, D.C. It includes regional reserve banks spread across 12 districts. Congress established the system in 1913 to set national monetary policy toward moderating interest rates, achieving maximum employment and stabilizing prices. Economists at regional banks inform decisions — such as setting target interest rates — that the Federal Reserve Open Market Committee makes during scheduled meetings.
The Federal Reserve’s Beige Book report comes out roughly every six weeks and offers anecdotes on recent regional economic conditions that journalists can use to complement or develop local stories. For example, economists from the Federal Reserve Bank of Kansas City, in the March 3 Beige Book, offer that “Input prices continued to rise faster than selling prices, and a large majority of firms reported being negatively affected by higher materials prices or a lack of available materials.”
The Beige Book was first publicly published in the 1980s with a beige colored cover. Find the archives here.
Beyond the Beige Book, the regional banks regularly produce national and local research that can help contextualize stories, no matter your beat — and bank economists are often willing to talk with journalists.
Covering public schools? Check out the Boston Fed, which has recent analysis on racial and socioeconomic gaps in elementary test scores in New England. Need to know how much cash Americans carry around on average? Check out the Atlanta Fed’s Diary of Consumer Payment Choice. How about climate change? The San Francisco Fed has data on how unusual weather affects employment. Covering racial inequality in the mid- and South Atlantic? Turn to the Richmond Fed. Need quick, embeddable national data on almost any economic topic? Try FRED from the St. Louis Fed.
Each regional bank also brings together financial experts to work on initiatives as part of their community development programs, which aim to spur economic growth for lower-income areas. Larger regional banks have their own branches, noted on the maps below, that provide money — “coin and currency” in Fed parlance — to local financial institutions. And, each bank promotes at least one research specialty, offering a wealth of authoritative, detailed data and analysis.
A few regional banks have mobile apps to help journalists and others keep up with their research. The Fed app consolidates new research from the Board of Governors and all 12 regional banks. From consumer finance to inflation to racial inequality, read on to learn each regional bank’s research specialty.
District 1, Boston, focuses on research and analysis on payment systems, which refers to novel financial technologies such as mobile payments and digital currencies. (The Philadelphia, Atlanta and Kansas City Feds also feature research on how Americans pay for goods and services.) Economists at the Boston Fed also analyze regulatory supervision of New England banks, and regularly produce research on other regional topics, such as racial and socioeconomic differences in elementary school test scores in New England metropolitan areas and New England economic indicators.
Connect with and explore research from the Boston Fed:
Leadership | Monetary Policy and Economic Research | Payment Studies and Strategies | Bank Supervision and Credit | Policy Perspectives | Working Papers | Main Street Lending Program | Community Development | Staff
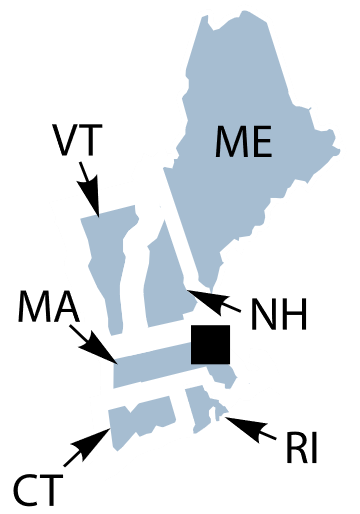
District 1 covers Maine, Massachusetts, New Hampshire, Rhode Island, Vermont and most of Connecticut.
District 2, New York, provides regularly updated numbers on household debt and consumer expectations on a range of public policies, such as unemployment insurance, through its Center for Microeconomic Data. Its Liberty Street Economics blog is a must-read for newsworthy, mostly national economics topics, including mortgage rates, bond market distress and supply chain disruptions, to name a few recent examples. You can also download the New York Fed’s economic research app, for on-the-go mobile reading. And if concepts like monetary policy and interest rates still seem alien, check out their comic book explainers. Oh, and the New York Fed has gold. Lots of gold.
Connect with and explore research from the New York Fed:
Leadership | Regional and National Data | Markets and Policy Implementation | Economic Research | Bank Supervision | Financial Services and Infrastructure | Center for Microeconomic Data | Education | Gold Vault | Community Development | Staff
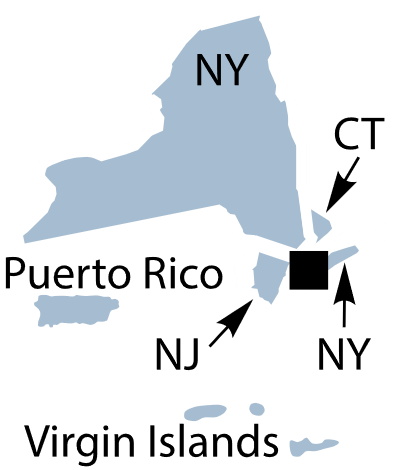
District 2 covers New York, western Connecticut, northern New Jersey, Puerto Rico and the U.S. Virgin Islands.
District 3, Philadelphia, is home to the Consumer Finance Institute. Economists at the institute focus on how consumers spend, borrow, pay for education and buy homes. They also produce research and data geared toward financial institutions on the health of the overall economy. The Philadelphia Fed conducts the Livingston Survey, which queries roughly two dozen economists in industry, banking, academia and government twice a year for their economic outlook over the coming months. Don’t miss the Survey of Professional Forecasters either. It’s released quarterly and based on the outlook of roughly 40 economic forecasters who use economic theory and modeling to make their predictions.
Connect with and explore research from the Philadelphia Fed:
Leadership | Monetary Policy | Banking and Financial Markets | Macroeconomics | Payment Systems | Regional Economics | Surveys and Data | Consumer Finance Institute | Banking | Community Development | Staff

District 3 covers most of Pennsylvania, southern New Jersey and Delaware.
District 4, Cleveland, hosts the Center for Inflation Research, a clearinghouse for understanding inflation data. Turn to the center for the latest inflation forecasts from Cleveland Fed economists and other current inflation research, and learn how economists at other federal agencies measure consumer prices. Cleveland Fed economists also study the economic past, present and future of the industrial heartland, also known as the rust belt, stretching from western New York to southeastern Wisconsin. Plus, the bank runs the Learning Center and Money Museum, where kids of all ages can learn the history of currency and why money has value.
Connect with and explore research from the Cleveland Fed:
Leadership | Regional Analysis | National Economy and Monetary Policy | Financial Markets and Banking | Financial Institution Data | Households and Consumers | Banking | Community Development | Staff

District 4 covers Ohio, eastern Kentucky, western Pennsylvania and northern West Virginia.
District 5, Richmond, features analysis of how racial inequality affects the regional economy, with recent reports on the racial wealth gap and how and where Black residents migrated to the area during the 20th century. Richmond Fed economists also analyze and produce research on access to credit, economic differences within the region and workforce development. And they conduct a quarterly, national economic outlook survey from a panel of more than 700 corporate financial professionals across a range of industries, in collaboration with the Atlanta Fed and Duke University.
Connect with and explore research from the Richmond Fed:
Leadership | Regional Economy | National Economy | CFO Survey | Banking and Supervision | Education | Community Development | Staff

District 5 covers Virginia, Maryland, the Carolinas, most of West Virginia and the District of Columbia.
District 6, Atlanta, offers GDPNow, a running estimate of gross domestic product growth. GDP captures the value of all goods and services produced in the U.S. The Atlanta Fed also surveys roughly 300 regional business representatives each month for its Business Inflation Expectations, which captures inflation rates firms expect to see over the coming year. Along with economists from Stanford University and the University of Chicago Booth School of Business, Atlanta Fed economists produce the Survey of Business Uncertainty, a national monthly panel survey of firms’ expectations for employment and sales over the coming year. Bookmark the Diary of Consumer Payment Choice, a yearly look at what we spend our money on, how we pay for things and the average amount of cash we each have in our pockets (Answer: $60). And download the EconomyNow mobile app to stay current on research from Atlanta Fed economists.
Connect with and explore research from the Atlanta Fed:
Leadership | Economic Mobility and Resilience | Inflation Project | National Economic Research | Regional Economics | Banking and Payments | Community Development | Staff
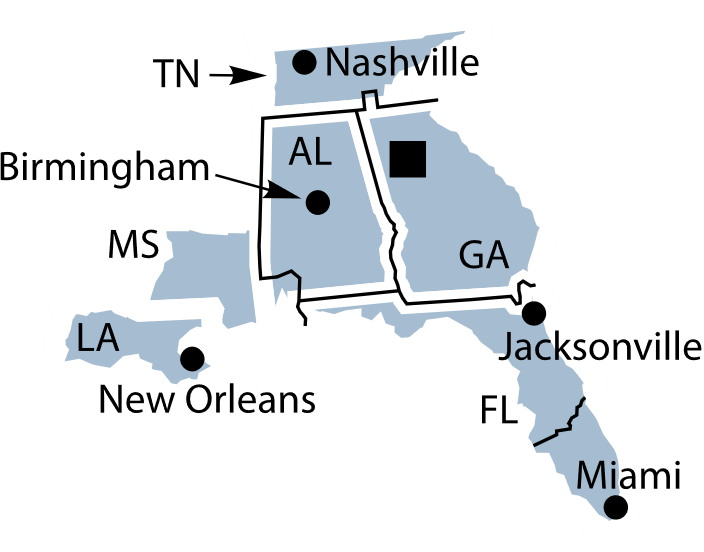
District 6 covers Alabama, Florida, Georgia, eastern Tennessee, southern Louisiana and southern Mississippi.
District 7, Chicago, provides analysis of insurance industry policy, insights on financial markets — including its LaSalle Street podcast — and data on agriculture conditions. The Chicago Fed Insights blog has regional analysis from the bank’s economists. The bank also offers a variety of financial data and forecasts, including on national and regional economic conditions and domestic bank holding companies.
Connect with and explore research from the Chicago Fed:
Leadership | Insurance Initiative | Financial Markets | AgConditions | Chicago Fed Letters | Chicago Fed Insights | Michigan Economy | Midwest Economy | Banking | Community Development | Staff
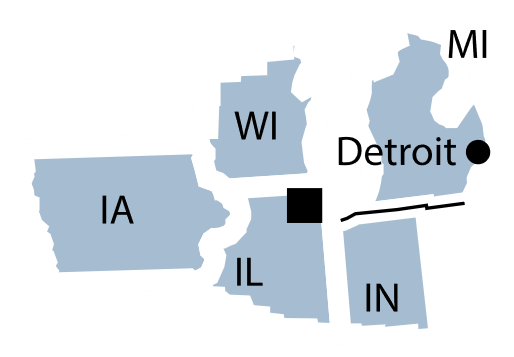
District 7 includes Iowa, most of Indiana, northern Illinois, southern and central Michigan and southern Wisconsin.
District 8, St. Louis, is perhaps best known for its FRED clearinghouse, a huge repository of current national and sub-national data on a range of topics, from industrial production to unemployment rates to exports and imports to U.S. Treasury bond yields. (FRED, by the way, is short for Federal Reserve Economic Data.) The bank offers several other information products, including ALFRED for archival FRED data, GeoFRED for maps, and FRASER for economic, financial and banking history. Most of the graphs, maps and data can be easily shared and embedded. The St. Louis Fed’s Economic Synopses series is another valuable source of newsworthy economic analysis.
Connect with and explore research from the St. Louis Fed:
Leadership | FRED | Economic Research | Podcasts and Webinars | Education | Economic Synopses | On the Economy Blog | Bank Supervision | Economy Museum | Community Development | Staff
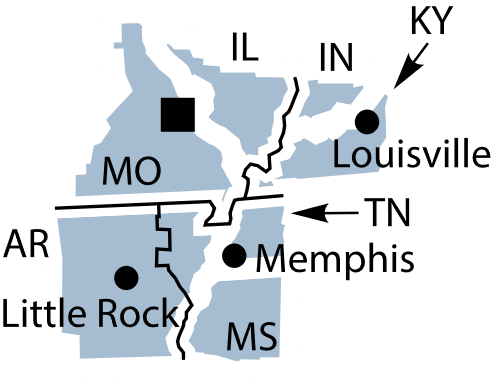
District 8 includes Arkansas, southern Illinois, southern Indiana, western Kentucky, northern Mississippi, central and eastern Missouri and western Tennessee.
District 9, Minneapolis, runs the Opportunity and Inclusive Growth Institute, which publishes working papers and policy briefs on regional and national challenges driving economic inequality. Minneapolis Fed economists also research Native American economic prosperity through the Center for Indian Country Development, including key economic indicators for American Indian reservations. The center also sometimes features research on non-economic topics, such as fatal encounters between police and Native Americans. Agriculture and farming constitutes another major research focus for the bank, which also has a real-time economic data dashboard for how COVID-19 is affecting the district. One example of data on the Minneapolis Fed COVID-19 dashboard: Higher-income earners in Minnesota regained employment losses by the end of 2020, while lower-income earners remained significantly unemployed.
Connect with and explore research from the Minneapolis Fed:
Leadership | National Economic Research | Opportunity and Inclusive Growth Institute | Center for Indian Country Development | Agriculture and Farming | Regional Economic Indicators | Banking | Community Development | Staff
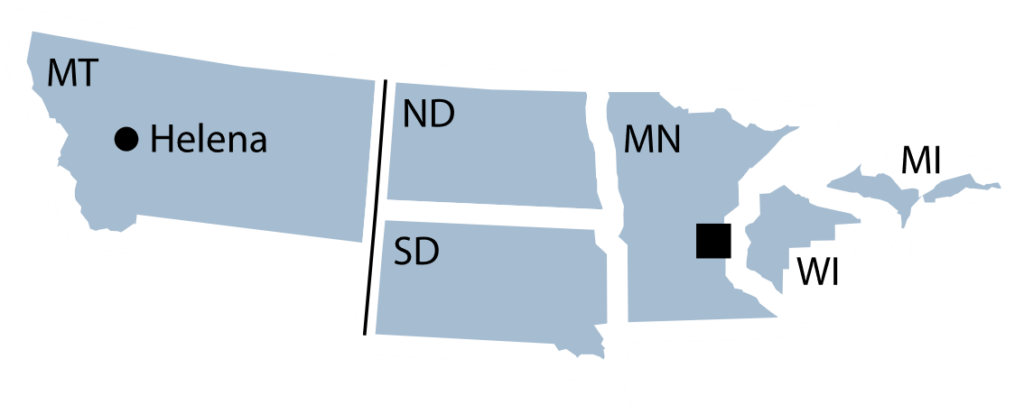
District 9 includes Minnesota, Montana, the Dakotas, Michigan’s Upper Peninsula and northern Wisconsin.
District 10, Kansas City, puts together quarterly surveys that provide current insight on credit conditions in the district for the agricultural sector and small businesses, as well as the economic activity of firms in the energy, manufacturing and service industries. The bank also publishes quarterly reports on economic conditions in Nebraska, Oklahoma and the Rocky Mountain region — Colorado, New Mexico and Wyoming. Check out its twice yearly Consumer Credit Report for consumer lending conditions in the district, and follow the Kansas City Financial Stress Index for data on the health of the U.S. economy.
Connect with and explore research from the Kansas City Fed:
Leadership | Financial Stress Index | Consumer Credit | Agriculture and the Economy | Ag Credit | Small Business Lending | Energy | Manufacturing | Services | Economic Review | Payment Systems | Banking | Education | Community Development | Staff
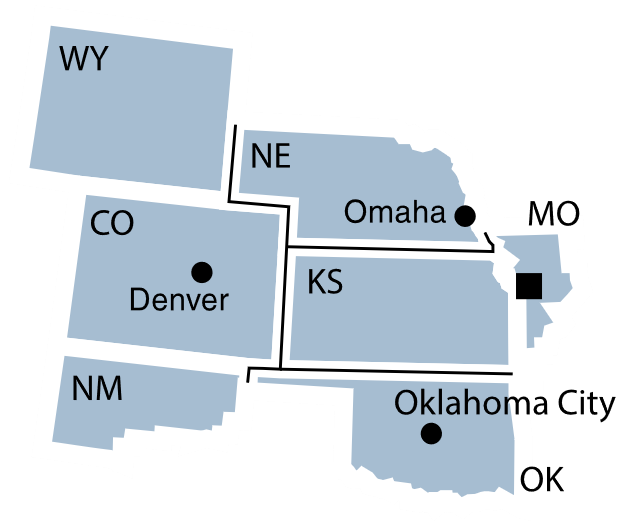
District 10 includes Colorado, Kansas, Nebraska, Oklahoma, Wyoming, western Missouri and northern New Mexico.
District 11, Dallas, in the heart of oil country, produces a huge amount of timely research and analysis on links between the energy sector and the broader economy. The bank’s Southwest Economy quarterly publication offers in-depth analysis on economic topics relevant to the regional economy, including parts of Mexico. Like other Federal Reserve Banks, the Dallas Fed conducts data-rich surveys offering economic insights on the regional agricultural sector, energy industry, manufacturing and service sector. The Dallas Fed also researches global economics through its Globalization Institute, which includes historical economic indicators from the Organization for Economic Cooperation and Development. Turn to the Dallas Fed Economics blog for timely analyses of newsworthy topics. One recent post notes that oil and gas bankruptcies were historically high in 2020. Finally, DataBasics sheds light on common methods economists use to interpret data, like seasonal adjustment and annualization.
Leadership | DataBasics | Globalization Institute | Dallas Fed Economics | Texas Economy | Southwest Economy | Banking | Education | Community Development | Staff

District 11 includes Texas, northern Louisiana and southern New Mexico.
District 12, San Francisco, covers nine states and one-fifth of the nation’s population, producing analyses on a diverse range of economic conditions. (Some economists have pondered whether the Federal Reserve district map, created more than a century ago, needs to be redrawn to more accurately reflect how regions contribute to the nation’s economy today.) The San Francisco Fed is home to the Center for Pacific Basin Studies, which publishes research notes and working papers on economic topics of regional, national and international interest, such as how automation affects workers’ wage negotiations. The bank also publishes indicators and data on economic growth in China, wage changes among U.S. workers, how unusual weather affects county-level employment and other newsworthy topics.
Leadership | Pacific Basin Studies | Working Papers | Economic Letters | Indicators and Data | Cash | Banking | Education | Community Development | Staff
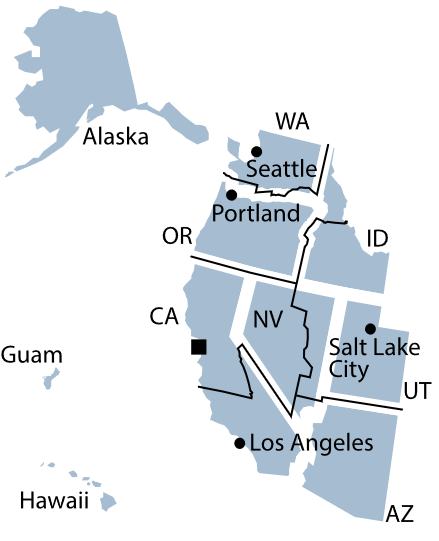
District 12 includes Alaska, Arizona, California, Hawaii, Idaho, Nevada, Oregon, Utah, Washington, American Samoa, Guam and the Northern Mariana Islands.
Expert Commentary