Research has consistently shown that income inequality in the United States has risen steadily over the past 30 years, and that the trend accelerated since the Great Recession. A 2013 study from U.C. Berkeley’s Edward Saez found that top earners were capturing an ever-increasing portion of income gains — including 95% of those during the 2009-2012 recovery. The reasons are complex, but include the spread of low-wage jobs, the decline of trade unions, an increasingly polarized job market and a vertiginous rise in CEO compensation.
Most economists agree that similar trends are playing out in other industrialized countries: A 2014 paper from the OECD found that in the 1980s, the top 1% of earners accrued less than 10% of all income in every OECD country except Germany. By 2010, this had more than doubled in the U.S. and United Kingdom, and had risen strongly elsewhere. A 2014 study from Thomas Piketty and Gabriel Zucman of the Paris School of Economics also found that wealth-income ratios have been rising in each of the top eight developed countries over the last four decades, from 200% to 300% in 1970 to 400% to 600% in 2010. “In effect, today’s ratios appear to be returning to the high values observed in Europe in the 18th and 19th centuries (600% to 700%).”
While the growth of income inequality is well documented, what is less clear is its relationship to economic output. In theory, having a measure of income inequality provides incentive for increased economic output. However, a 2014 OECD report found that economic inequality and economic growth were inversely related — countries with falling rates of inequality grew more strongly than those with rising rates. The “key factor” in increasing inequality was a lack of investment in education, the report found.
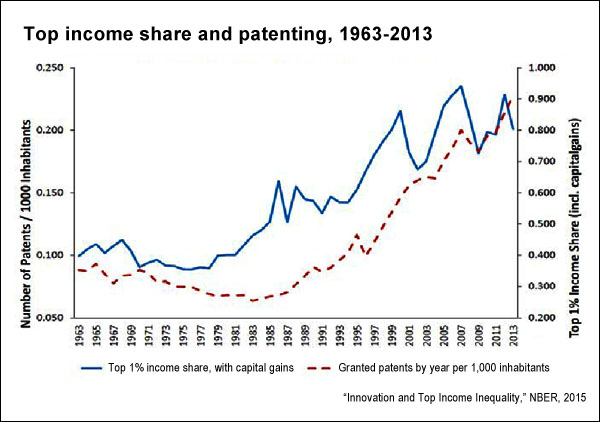
In a 2015 working paper for the National Bureau of Economic Research (NBER), researchers from Harvard University, University of Pennsylvania, University College London, INSEAD and Banque de France further explore this subject. The report, “Innovation and Top Income Inequality,” uses panel data over the period of 1975-2010 across U.S. states and examines the links among innovation, top income inequality and social mobility. The number of patents granted was used as a measure for state innovativeness.
Key findings include:
- Overall, “an increase in 1% in the number of patents per capita increases the top 1% income share by 0.17%.” This finding is robust if the researchers adjust the number of patents by quality. The effect of innovativeness “on the top 1% income share is always positive and significant at the cross state level.” The result is consistent even when controlling for the size of the financial sector and government.
- In California between 1975 and 2009, “the increase in innovativeness can explain 22% of the increase in the top 1% income share over that period. On average across US states, innovativeness as measured by the number of patents per capita explains about 17% of the total increase in the top 1% income share over the period between 1975 and 2010.”
- While innovativeness is positively correlated with high levels of income inequality, it is “less positively or even negatively correlated with measures of inequality which do not emphasize the very top incomes, in particular the top 2% to 10% income share (i.e. excluding the top 1%), or broader measures of inequality like the Gini coefficient or the Atkinson index.”
- There is evidence of a positive effect of innovativeness on upward social mobility: “The lower the quintile to which parents belonged, the more positive and significant is the correlation between innovativeness and upward mobility.”
- The positive correlation between innovativeness and social mobility is driven mainly by entrant innovators and less so by incumbent innovators. Consequently, in states with high levels of lobbying, “entrants seem to have more difficulties to innovate.”
“Our results show positive and significant correlations between innovativeness or frontier growth on the one hand, and top income shares or social mobility on the other hand,” the scholars conclude. They note that the research raises important questions, such as “how should we combine tax policy with other policy instruments (competition and entry policy, patent policy, R&D subsidies,…) to achieve more inclusive growth, i.e. reconcile the goals of enhancing innovation-based growth, enhancing social mobility, and avoiding excessive income inequality?”
Keywords: Income inequality, innovation, innovativeness, social mobility, entrepreneurship, technology


Expert Commentary