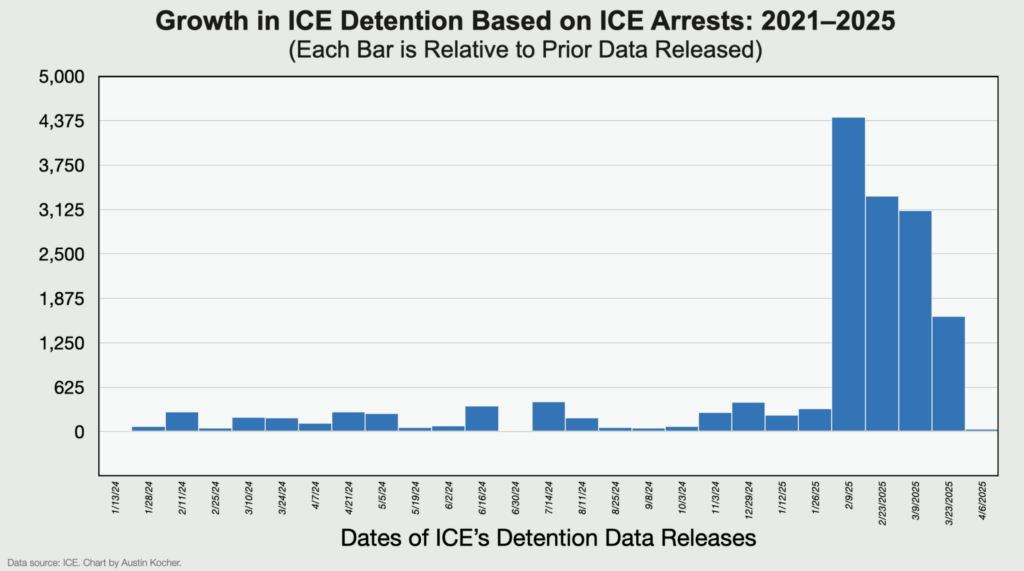
The number of people held in immigration detention by U.S. Immigration and Customs Enforcement essentially flatlined this month. The total detained population—counted as beds occupied at midnight on a single day—barely increased from 47,892 to 47,928 between March 23 and April 16, an increase of 36. There’s more than meets the eye, however. Journalists should not interpret this as evidence that ICE is not arresting and detaining people.
In fact, this gives us an opportunity to level-up our understanding of detention data. Let’s dive into it.
While the decline in detention growth is a significant departure from the recent weeks of growth, it should not come as a huge surprise. The graph below shows comparative growth between each ICE detention data release, which emphasizes growth or decline.

So why is detention growth flat?
One reason is that there are two interrelated trends right now: ICE arrests are going up, while U.S. Customs and Border Protection arrests are going down. They don’t always offset each other exactly and they can increase or decrease independently. But right now, the increase in border militarization and the increase in interior enforcement combine to result in fewer people coming across the border (leading to fewer CBP detentions) and more ICE arrests.
But this doesn’t explain the entire story.
I usually report total detained population on a single day. But two other numbers are relevant to how we understand the total detained population: book ins and length of stay.
Think about detention as a flow process: people enter the system, remain in it for some period of time, then are released (either back into the country or through deportation). Total detained population only represents a snapshot of a dynamic system on a single date at midnight. That doesn’t tell us much about the entire flow through the system. To understand that, we would need to know how many people enter the system and how long they stay.
We don’t have perfect data on this, but we do have monthly book ins and average length of stay. Since January, ICE has definitely increased the number of people it books into detention facilities, and CBP has decreased. This reflects and reaffirms what we already know.
At the same time, the overall average length of stay has decreased since January from around 52 days to around 46 days—and it’s even less for people arrested by ICE who tend to remain in detention for around 40 days. That’s not a huge change, but it is notable.
What this all means is that, yes, ICE might not be able to keep up the pace of its initial surge in arrests and detention. But it also means that people are moving through the detention system more quickly—including due to faster deportations. It is an opportunity to remember that the total detained population statistic is only one way of looking at detention data. In reality, the total number of people detained over a period of time is always higher than the number of detained people on a single day.
To be consistent with my previous posts, here’s one last note about the data. While the initial surge in detention led to a predictable rise in the total and fractional number of non-immigrant violators, the compositional changes seemed to have settled out for the moment. Nothing new to report here, with the proportions of the three levels of criminality remaining steady since late February.
You can find the ICE’s detention data sheet here or download the raw file here. Please get into the data yourself and let me know what you find — or if you have questions about how to make sense of the data. The more the merrier.
An earlier version of this commentary first appeared on Austin Kocher’s Substack page. We’re republishing it with his permission.


Expert Commentary