


“Follow the money,” the editor bellowed at the cub reporter. That’s something you hear a lot in newsrooms. And top reporters follow that advice.
Even if you are not working on a big investigation, a basic understanding of financial statements is essential for any reporter. They are a reliable source for news stories, and not just on the business beat. Understanding a company’s books helps you know which questions to ask about a company’s operations and business dealings, allowing you to look beyond the press releases.
If a company is publicly traded — its shares are bought and sold on a stock market — it must file extensive documentation with the Securities and Exchange Commission (SEC), a U.S. government body. The SEC was set up after the Great Depression and tasked with overseeing capital markets, ensuring transparency, fairness and protecting investors against fraud. It provides registration information, financial statements and other information through its EDGAR (electronic, data gathering, analysis and retrieval) database.
For an example, let’s look at The New York Times Company, the parent of the eponymous paper, which is traded on the New York Stock Exchange (NYSE) under the ticker symbol NYT.
EDGAR provides a number of forms for The Times. (When searching, sometimes you need to leave the article “the” off the beginning of a company’s name.) Here is what is available:
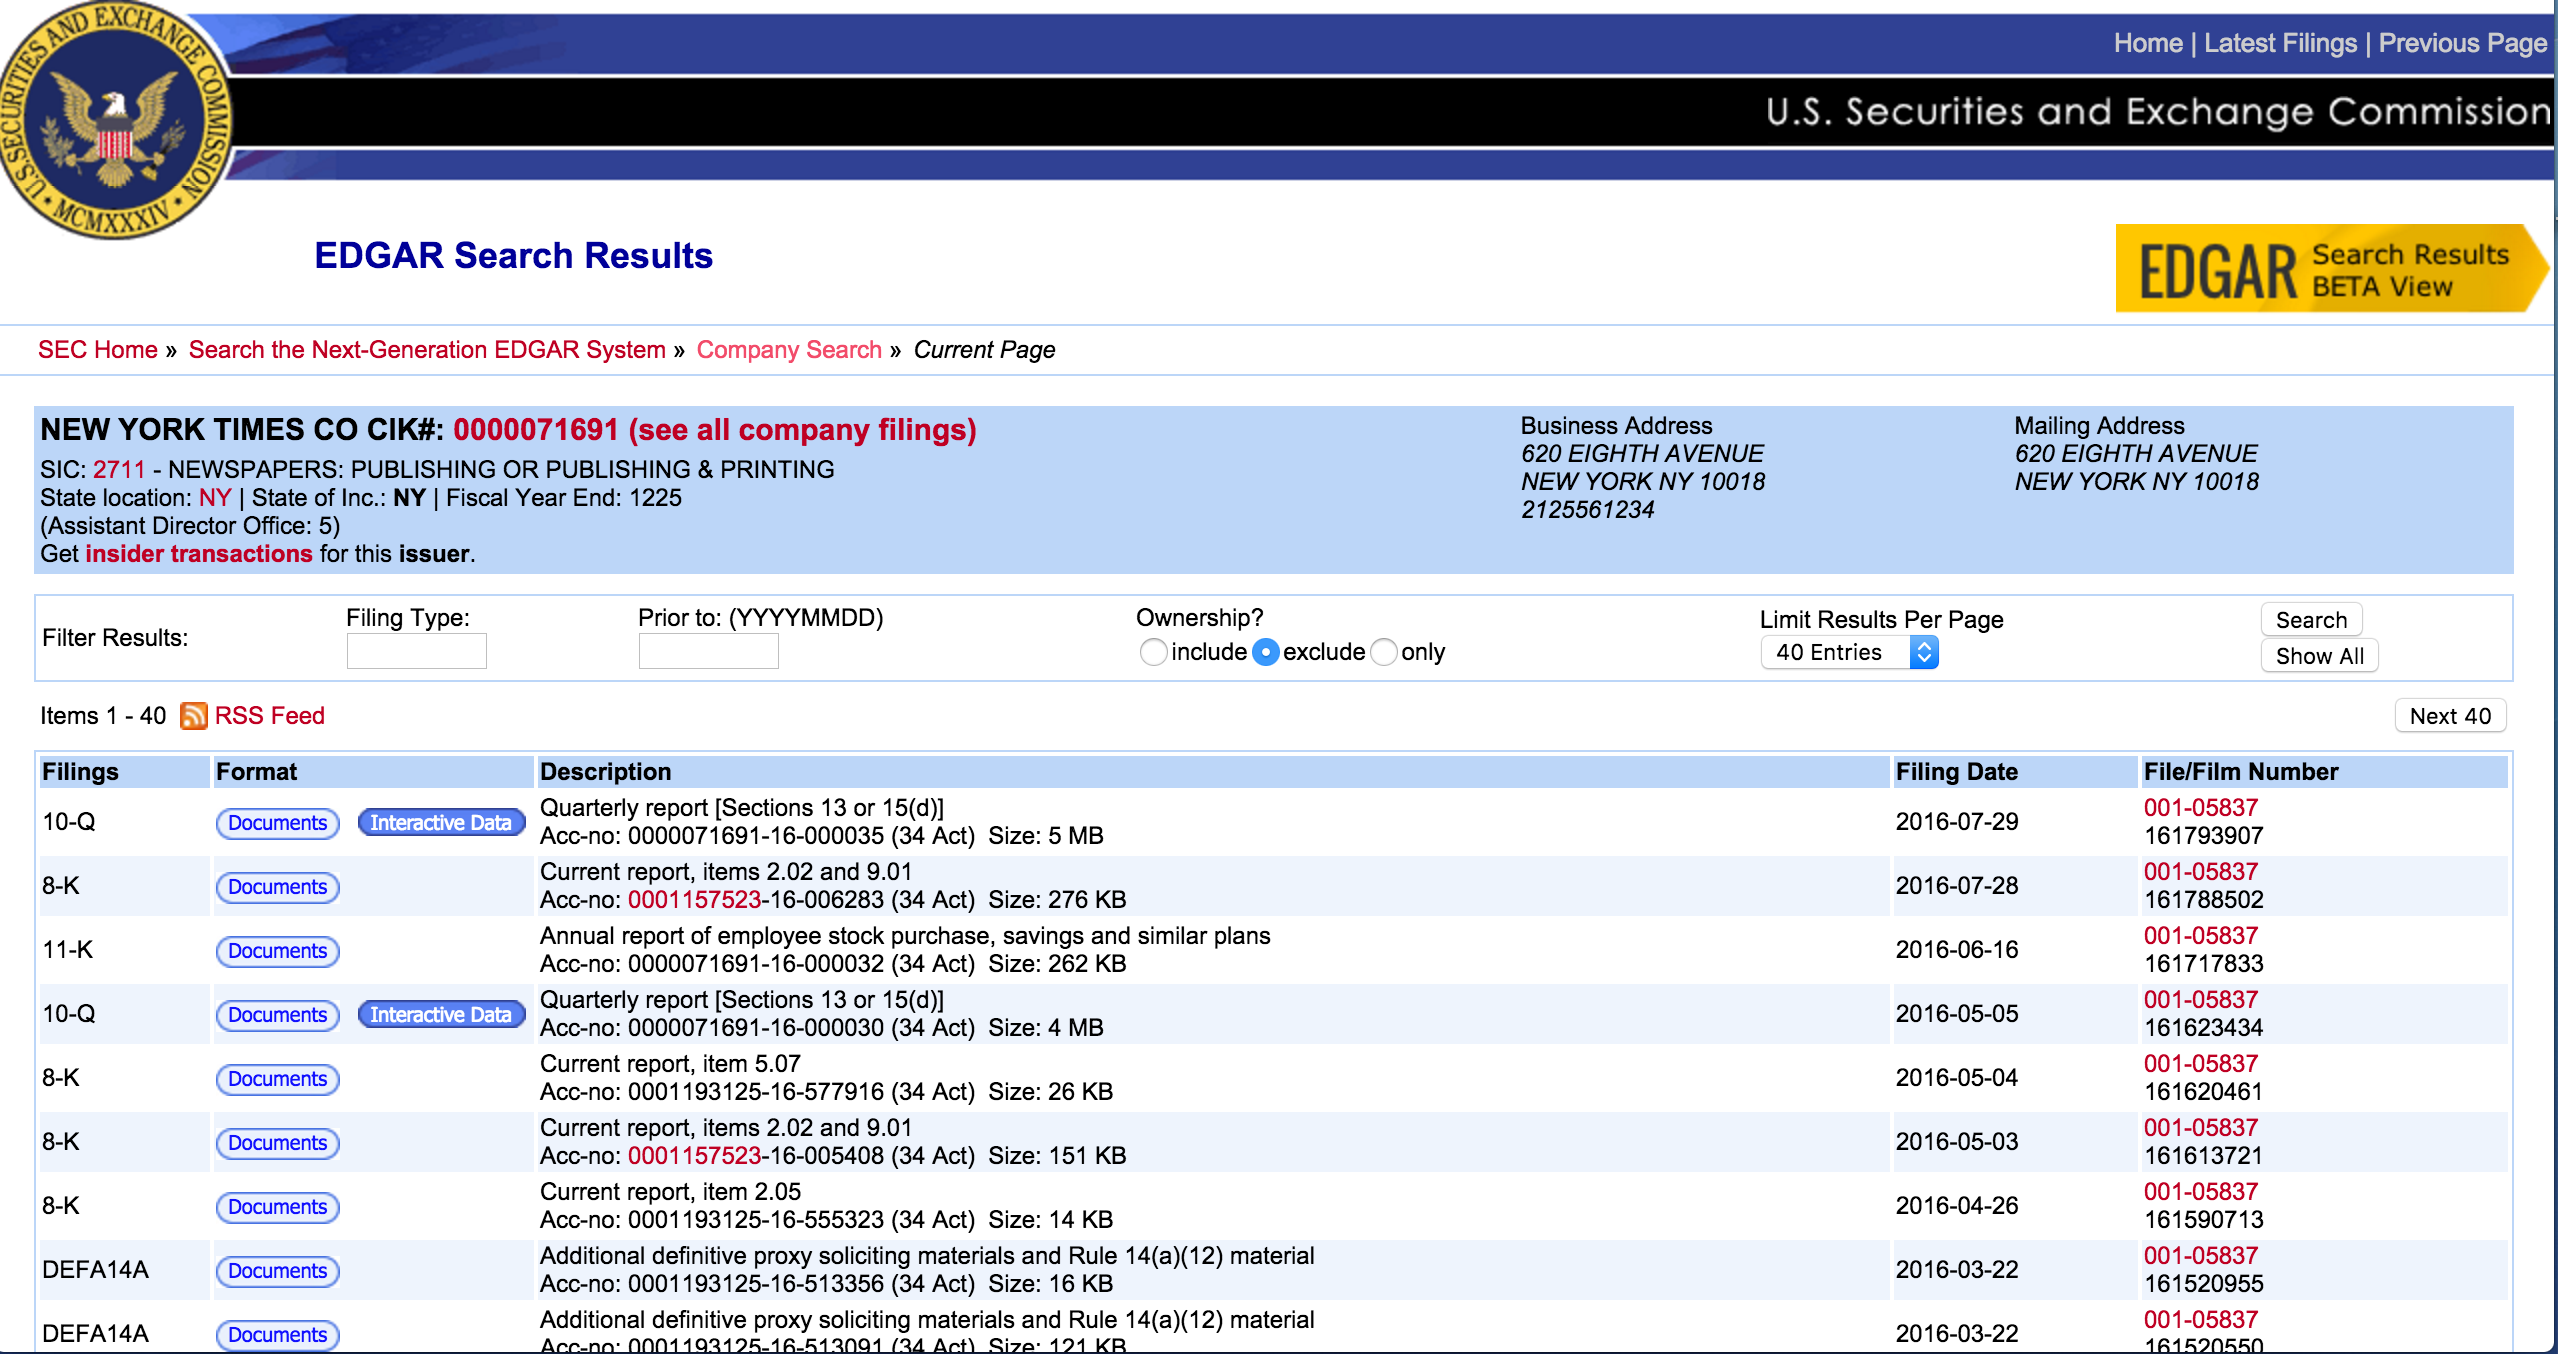
A company’s audited annual report — its 10-K — includes data and information on the company’s performance, including its organization, history, equity, earnings, subsidiaries and more. Under SEC regulations, it must be filed 60 days after the end of the company’s fiscal year. A 10-Q is a quarterly report (except for the fourth quarter, when it is a 10-K) that is generally not audited. The SEC requires more information in a 10-K. On the occasion when a company is unable to file either report, it must explain why in a form called an “NT” 10-K or 10-Q. Investopedia, a great resource, lists other forms here.
Journalists also can read a company’s official annual report, which is often nicely laid out and adorned with color photos. But the 10-K will offer more comprehensive information.
The New York Times Company’s fiscal year ends on Dec. 27. In this case, its most recent 10-K appeared on EDGAR on Feb. 24, 2016. You can find it by searching for the company in EDGAR and then scrolling down to the 10-K. Click “documents” and open the form listed at the top. You will get a long page of text and spreadsheets.
A 10-K gives a much better overview than quarter-to-quarter documents, because many businesses experience seasonal cycles. If you’re looking for specific information or key terms, use control-F or Apple-F to search.
Income statement and the bottom line
The income statement reports on a company’s performance over a given period, including revenues and expenses, inflows and outflows. The Times calls this a “statement of operations”; it is sometimes also known as a statement of earnings or a profit and loss (P&L) statement. The Times further breaks this down in a section called “Results of Operations.”
A firm has some freedom to choose how it presents information on its 10-K. There are often a number of terms for the same thing. Be aware that numbers often are abbreviated — for example, a value written as $1,575 could mean $1,575,000. Many journalists have stumbled over a set of three zeros. A key should explain how numerical values are presented.
To calculate “the bottom line,” (a.k.a. net income), subtract all expenses — the cost of doing business, taxes and interest payments, depreciation and other expenses — from revenues.
For the last four years, the Times has posted a profit. In 2011, it lost over $37 million. But does that mean the company is healthy? Newspapers are operating in a tough environment with print ad revenues declining and digital returns slow to offset the losses.
Circulation revenues grew from $824 million in 2013 to $846 million in 2015. In the same period, advertising revenues fell — from $667 million to $639 million. The Times chooses to break these numbers down further, showing that though the print advertising and classified revenues are falling, “other advertising revenue” is growing: “Other advertising revenue primarily includes creative services fees associated with our branded content studio; revenue from preprinted advertising, also known as free-standing inserts; revenue generated from branded bags in which our newspapers are delivered; and advertising revenues from our news services business.”
Balance sheet
The balance sheet reports a company’s financial situation at a single point in time. This statement will include assets, liabilities and equity (assets = liabilities + equity). At the Times:
Assets:
- Cash, cash equivalents and marketable securities — these are liquid.
- Property, plant and equipment (PP&E) — these are not liquid.
Liabilities:
- Total debt and capital lease obligations — what the company owes.
Equities:
- Total New York Times Company stockholders’ equity — what the company is worth to its shareholders.
MD&A
The Management’s Discussion and Analysis (MD&A) section outlines management’s take on the firm’s financial performance. The SEC requires these statements to help investors see the company as the managers do, providing a level of transparency not available for privately held firms.
This section is a helpful summary of the firm’s operations as well as its future plans and new products. Here we find comments on the shifting newspaper industry overall and the management’s strategy for tackling adverse situations. Profits and losses from other investments are discussed here, as well as the firm’s capital structure (its debt and equity). And consider other interesting tidbits that will help you craft a story: For example, at the Times the changing cost of newsprint is a factor. You learn this in the MD&A. Here, you also learn that the Times’ digital-only subscribers grew to over 1 million in 2015, a 20 percent increase.
Valuing a company — or how to compare companies
One quantitative way to analyze a firm’s financial health, or compare companies, is with ratios. Often expressed as percentages, ratios are calculated by crunching numbers from the financial statements. They are useful when compared to previous years, to different companies in the same industry or sometimes to the economy overall. Investopedia has a step-by-step tutorial on how to analyze 19 different ratios.
A few examples:
Return on Equity (RoE) — This ratio measures how efficiently a company is run, specifically how the management looks after funds the shareholders have invested. It is portrayed as a percentage and calculated by dividing the net income (from the income statement) by the average stockholders’ equity (from the balance sheet). Compare against companies in the same industry and against the market as a whole. (Data from Yahoo! Finance.)
- NY Times 5.72%
- tronc Inc. (formerly Tribune Publishing) -19.76%
- Gannet Company 9.64%
- Facebook 11.15%
- Google (Alphabet Inc.) 15%
Return on Assets (RoA) — This is a measure of how profitable a company is relative to its assets, the invested capital. Calculate by dividing net income by total assets (balance sheet). This is sometimes called return on investment (RoI). Because these numbers vary significantly between industries, it is more useful to compare companies within one industry or compare a single company across years.
The Debt-to-Equity (D/E) ratio compares the company’s total debt to the shareholders’ equity (how much the shareholders own). Debt-to-equity ratio = total liabilities / shareholders’ equity. Both figures are available on the balance sheet. At the Times, the ratio is 0.52, which is equal to the total debt and capital lease obligations ($431,228,000) divided by the total New York Times Company stockholders’ equity ($826,751,000). So, for every 52 cents of debt, shareholders have invested one dollar in the company. The company is taking on debt at half the rate its owners are investing in it. A lower debt-to-equity ratio indicates lower risk. By comparison, the owner of USA Today, Gannet Company, has a 1.29 ratio. By this measure alone, The New York Times Co. is in better financial shape. Facebook, with its favorable stock price, has a ratio of 0.117.
Cash flow statement
The cash flow statement details how a company manages its cash — or how liquidity is impacted by changes to a company’s balance sheets and income statements. It deconstructs spending into operating, investing and financing activities. This is useful for determining a company’s short-term viability and its ability to pay its bills.
The Times does not include a statement of its free cash flow (FCF): the cash it generated after accounting for the expenses necessary to run its business (operating cash flow minus capital expenditures). This is not required by the SEC.
By contrast, Facebook Inc. (FB :NASDAQ), a media company that had a very good fiscal 2015, is eager to boast about its free cash flow. Perhaps that’s because its FCF is impressive. In Facebook’s case, this means subtracting purchases of property and equipment ($2.5 billion) from net operating cash ($8.6 billion). Facebook calls FCF “one of the key financial indicators of our business performance over the long term. … [It] can provide useful supplemental information to help investors better understand underlying trends in our business.”
But FCF is not a substitute for other indicators or useful for making comparisons, because a company can choose how to define its FCF and because it does not reflect future commitments. Moreover, FCF can vary over time, depending on the business cycle or where the company is relative to plans for expansion.
Stock data online
More valuation information can be gathered from Yahoo! Finance, Google Finance or other aggregators. Like the income statement, the balance sheet and the cash flow statement, these websites offer loads of updated information on shares and trading as well as ratios for comparison. One headline figure is market capitalization (“market cap”), which is calculated simply by multiplying total shares by the value per share. When we say something is an X-billion-dollar company, this is the figure we’re using.

Debt
Other ratios — such as cash flow to debt — allow us to analyze the risk of bankruptcy. Debt alone is not a bad thing — it allows a firm to borrow against future profits and expand operations. But it can also present risks. Assessments from ratings agencies such as Standard & Poor’s and Moody’s Investor Services help determine the interest a company pays to service its debt.
Footnotes
The 10-K includes many other clues on how a company is run. Besides listing major shareholders, the narrative describes what kind of concerns the management has going forward and how it plans to address them. Do not overlook the footnotes. They are packed with information.
Footnotes are where firms discuss their accounting policies, their subjective decisions and where they disclose their tax rates and debt obligations. Here they discuss stock options and how senior employees benefit. They also discuss pension plans and disclose how much these may be over- or underfunded. (More on the Times’ pension problem below.)
Though executive compensation is not detailed in the 10-K, the footnotes tell you where to look: another document filed with the SEC, the Proxy Statement for the 2016 Annual Meeting of Stockholders.
Two highlights from the Times’ 10-K that could make stories:
- The Times has shed over 50 percent of its staff in the last four years. Staff fell from 7,273 in 2011 to 3,560 in 2015. Some of this is from attrition and buyouts. But the company comments and warns investors: “Over the last several years, we have taken steps to reduce operating costs across the company, and we plan to continue our cost management efforts. […] if we do not manage cost-reduction efforts properly, such efforts may affect the quality of our products and therefore our ability to generate future revenues. And to the extent our cost-reduction efforts result in reductions in staff and employee compensation and benefits, this could adversely affect our ability to attract and retain key employees.” Note, however, that during this period, The Times also sold The Boston Globe, About.com and other assets, which could explain some paring of staff.
- The Times’ pension plans have “significant underfunded liabilities.” That means the expected cost of future obligations exceeds the means to pay for them. In this case, the pensions were underfunded at the end of 2015 by approximately $520 million — qualified benefit plans by $273 million and non-qualified plans by another $247 million. The Times is offering lump-sum payments to some former employees to mitigate the liabilities, but nevertheless, “As a result of these required contributions, we may have less cash available for working capital [investments] and other corporate uses, which may have an adverse impact on our results of operations, financial condition and liquidity.”
Other countries:
Several other countries offer databases similar to EDGAR for firms listed on local stock markets, though filing requirements are different.
- Canada has SEDAR.
- The United Kingdom has Companies House.
- The European Union has struggled to create a centralized disclosure system, but the Committee of European Securities Regulators is reportedly working on it. Meanwhile, search through the country in which a company is listed on a stock exchange.
- The Frankfurt Boerse — the Frankfurt stock exchange — links to recent fillings by companies listed there.
- You can also use France’s Trade and Companies Register and the Tokyo Stock Exchange. And many more.
Other helpful resources:
- The SEC has a guide to financial statements for beginners.
- Investopedia is a popular resource among MBA students.
- Duke Professor Campbell Harvey’s Hypertextual Finance Glossary claims to be the largest financial glossary on the internet.
- The Economist has an excellent online glossary of economics terms.
- Journalism.co.uk has a primer on starting out in financial journalism.
- Journalist’s Resource has other tip sheets on economics and finance, such as this one on five stories to look for in financial statements and this one on types of SEC filings.
Journalist’s Resource would like to thank Suresh Nallareddy, professor of accounting and financial statement analysis at Duke University’s Fuqua School of Business, for his help preparing this tip sheet.
Keywords: financial accounting, financial statements, financial journalism
Expert Commentary