The political debate over how best to reduce the growing federal deficit has focused in large part on how entitlements such as Medicare should be reformed. The 2011 “Annual Report of the Boards of Trustees of the Federal Hospital Insurance and Federal Supplementary Medical Insurance Trust Funds” addresses a number of pressing issues in terms of funding and solvency. (Reports for other years are available from the Centers for Medicare and Medicaid Services.)
The report states at the outset that its estimates are based on the anticipated cost-saving effects of the Affordable Care Act (the major health care reform bill passed in 2010); moreover, it notes that “actual future costs for Medicare are likely to exceed those shown by the current-law projections in this report,” and the estimates are based on certain favorable scenarios in terms of legislative action.
The report defines Medicare’s two main components as follows: “Hospital Insurance (HI), or Medicare Part A, helps pay for hospital, home health, skilled nursing facility, and hospice care for the aged and disabled. Supplementary Medical Insurance (SMI) consists of Medicare Part B and Part D. Part B helps pay for physician, outpatient hospital, home health, and other services for the aged and disabled who have voluntarily enrolled. Part D provides subsidized access to drug insurance coverage on a voluntary basis for all beneficiaries and premium and cost-sharing subsidies for low-income enrollees. Medicare also has a Part C, which serves as an alternative to traditional Part A and Part B coverage.”
Key findings in the Trustees’ 2011 report include:
- “In 2010, 47.5 million people were covered by Medicare: 39.6 million aged 65 and older, and 7.9 million disabled.… Total benefits paid in 2010 were $516 billion. Income was $486 billion, expenditures were $523 billion, and assets held in special issue U.S. Treasury securities were $344 billion.”
- “The number of Medicare beneficiaries is currently increasing by about 3% per year, and this growth rate will continue as more of the post-World War II baby boom generation reaches eligibility age. As a result of the recent recession, the number of individuals with private health insurance is projected to decline through 2011 and increase only slowly in 2012-2013.”
- “The financial status of the HI trust fund was substantially improved by the lower expenditures and additional tax revenues instituted by the Affordable Care Act. However, the HI trust fund is now estimated to be exhausted in 2024, five years earlier than was shown in last year’s report, and the fund is not adequately financed over the next 10 years.”
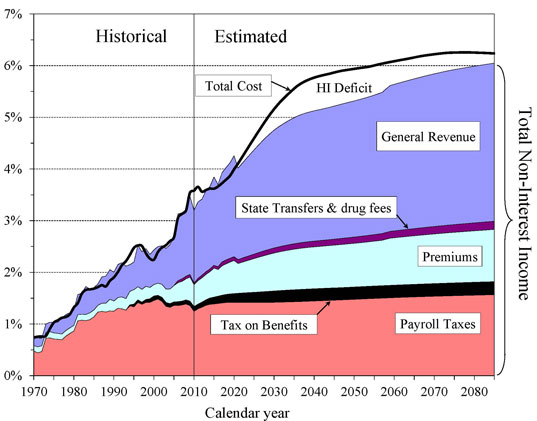
- “As a percentage of GDP, expenditures are estimated to increase from 3.6% in 2010 to 6.2% by 2085…. If Congress continues to override the statutory decreases in physician fees, and if the reduced price increases for other health services under Medicare become unworkable and do not take effect in the long range, then Medicare spending would instead represent roughly 10.7% of GDP in 2085.”
- “Medicare expenditures represented 0.7% of GDP in 1970 and had grown to 2.7% of GDP by 2005, reflecting rapid increases in the factors affecting health care cost growth. Starting in 2006, Medicare provided subsidized access to prescription drug coverage through Part D, which caused most of the increase in Medicare expenditures to 3.1% of GDP in the first year.”
The following chart shows Medicare’s growth relative to GDP over time, and future projections:
(For a look at the projections and parallel challenges for Social Security, see the Trustees 2011 report.)
Tags: Congress, budget, deficit, campaign issue, Social Security, health care reform


Expert Commentary